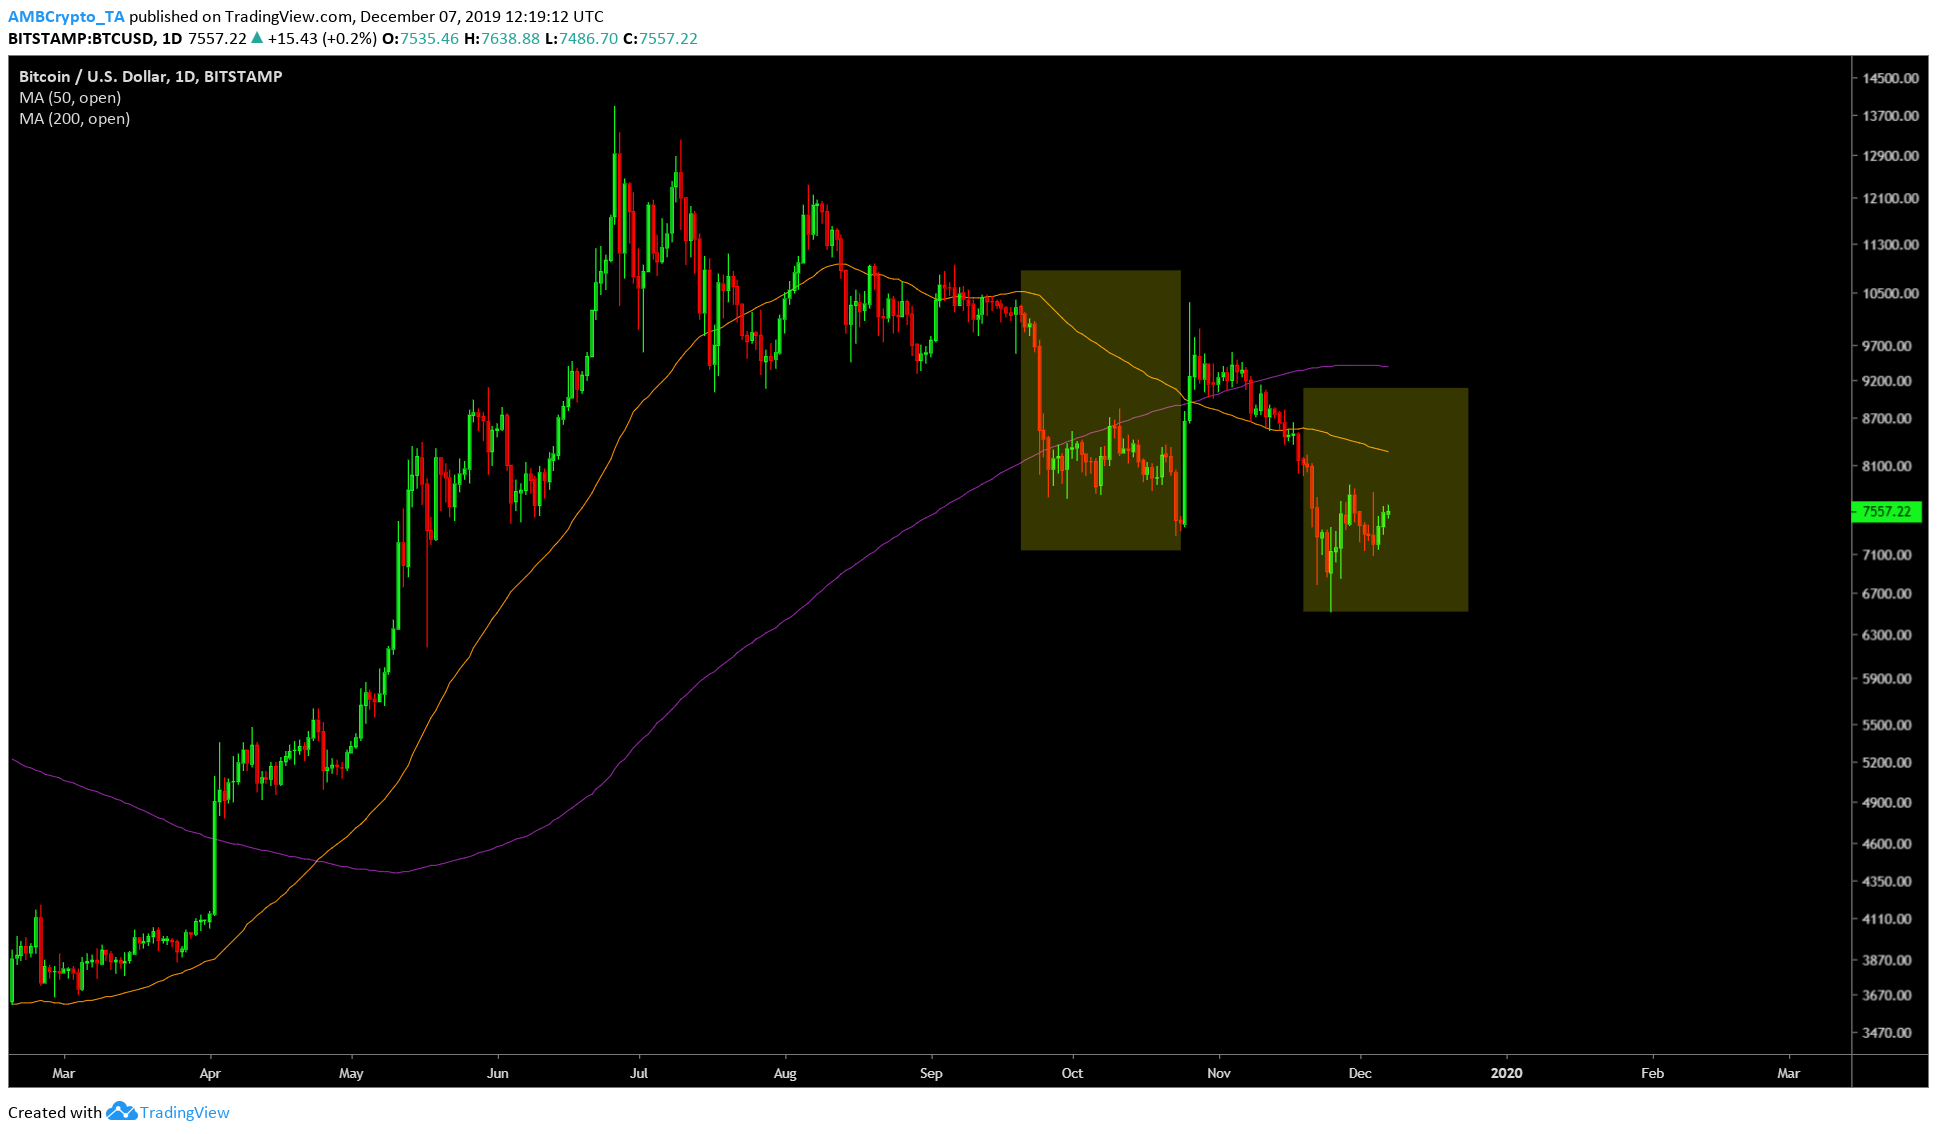
Bitcoin’s journey through 2019 has been extremely volatile; starting at $3,000 and reaching a high of $13,800. Bitcoin’s price seems to be stuck in the $7,000 range for more than two weeks and the pattern formed since then indicated an incoming bearish move.
BTC is in an ascending channel forming higher highs and higher lows. Since the price is at the end of the channel it indicates that a breakout is near.

Source: BTC/USD TradingView
The last dip took BTC to $6,678, which was followed by a rally to $7,870. If and when the price of Bitcoin breaches this pattern, the price would have a higher chance to breach lower and possibly retest the $6,600 range.
MACD showed that it was on the verge of a bearish crossover while RSI was yet to hit the overbought zone. There is a chance that the price will drop after MACD and RSI reach their point of inflection. However, it seems that the price might have another leg up before the breach might occur.

Source: BTC/USD TradingView
Moreover, the daily chart for BTC shows that the death cross is still intact, with the price being sufficiently far away from the 200-day MA. Additionally, the price on the daily time frame has also slipped below the 50-day MA, indicating a persistent bearish pressure on BTC.
To further the bearish sentiment, BTC’s current price action looked like it is repeating the pattern from September 20 to October 23. If the fractal follows through, the price will drop even lower than it did on November 25, probably toward $6,200.

As of December 07, 2019, the fear greed index showed what the charts confirmed – ‘fear’. Although the fear index has reduced – it has ebbed down from an ‘extreme fear’ from the previous week. For the next leg up before the breach out of the parallel channel, the fear-greed index will shift toward greed.

Source: BitVol
The plateau of volatility has ended and has collapsed from 4% to 2.5% while the price moves sideways and inside the pattern. A resurgence of the volatility can be expected if and when the breakout occurs.
A total of 12.3 billion longs have been liquidated since the start of 2019; however, at press time, a total of $645,000 longs were liquidated on BitMEX exchange. If the bearish scenario does come to pass, the long liquidation number would only increase.
The post appeared first on AMBCrypto


