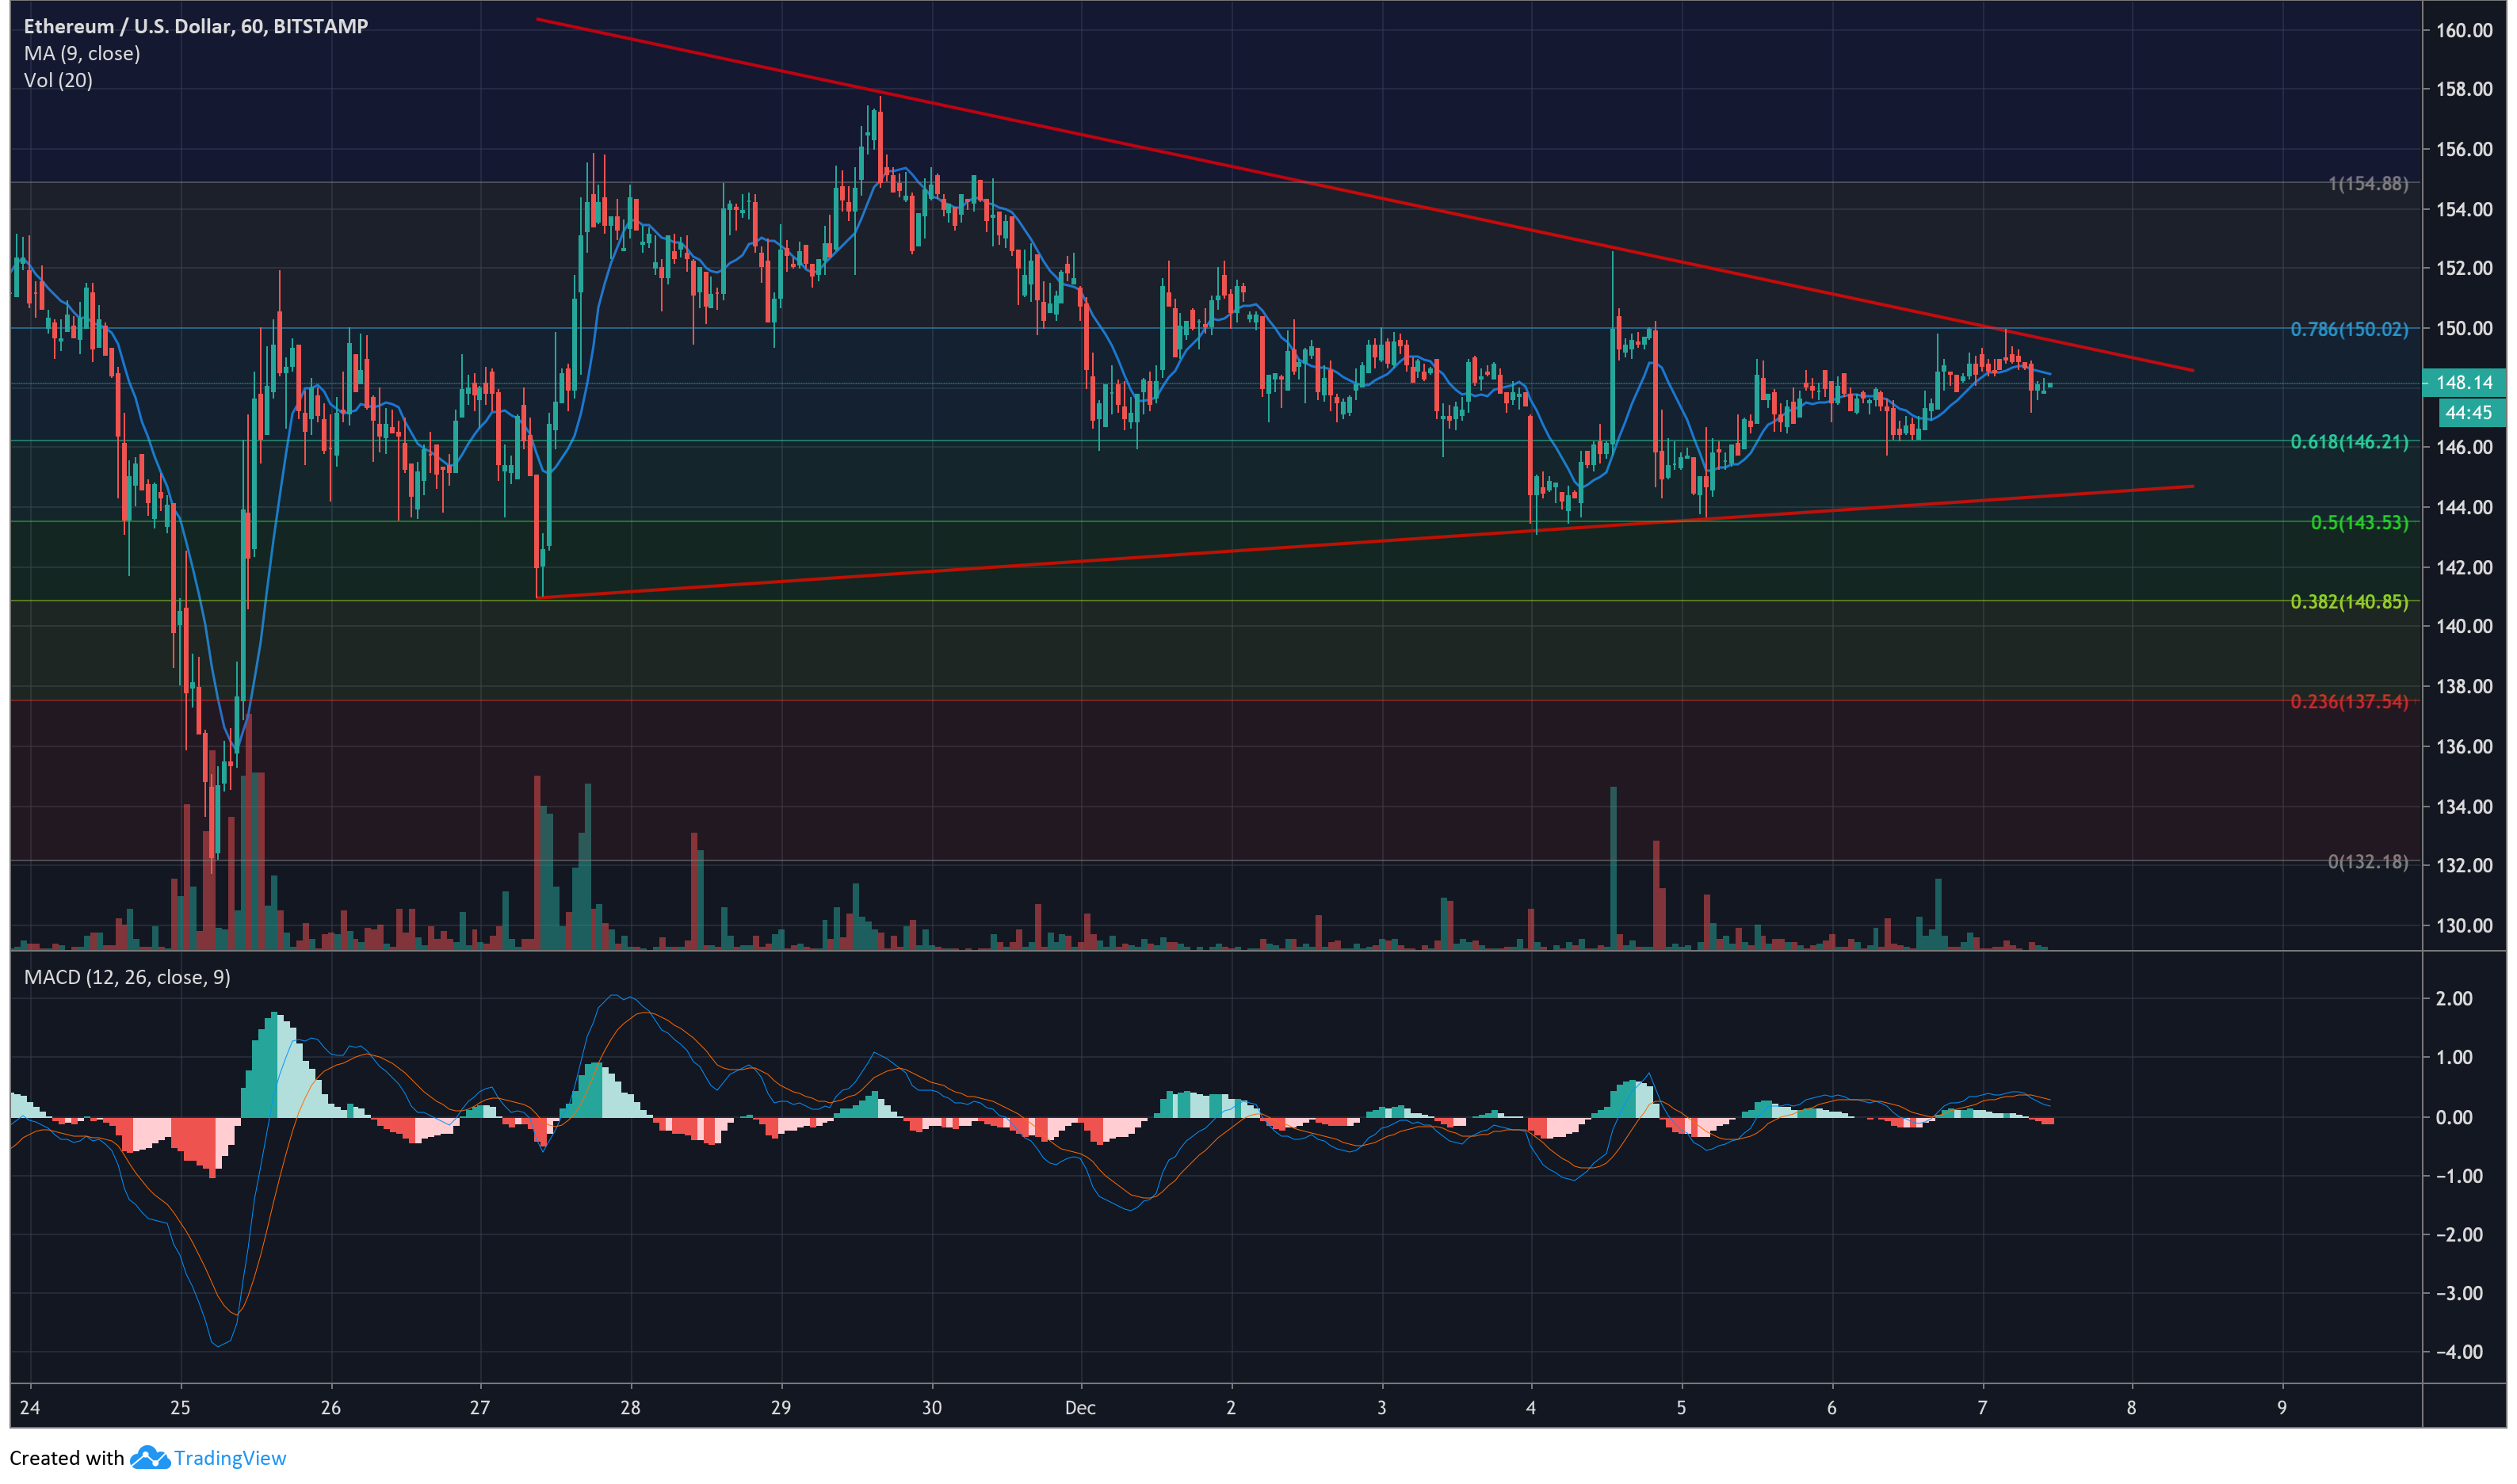
After touching an 8-month low on November 25, the Ethereum community saw the flagship coin make some modest gains, including a brief move up to $156 two days before December began. Since then, ETH has been consolidating between the $150 and $146 marks, with a value of $148 at the time of writing.
CoinMarketCap shows that Ethereum has a market capitalization of over $16.2 billion, with more than $6.3 billion worth of ETH sold on the previous day. Additionally, it was traded most on the Bilaxy exchange, which accounted for around 4% of trade volume over the 24-hour period.
Ethereum 1-hour chart

Source: ETHUSD on TradingView
ETH entered a pennant pattern formation toward the end of last month and has been zig-zagging between the pattern trend lines since then. The 1-hour chart above shows an accompanying decreasing volume trend, which is standard in 89% of cases for this pattern. Pennants tend to favor upward breakouts, but only slightly, with a 57% bias, gently supporting a short-term move up in the native Ethereum cryptocurrency’s value.
MACD showed less optimistic signs, with the signal line having recently moved over the MACD line into a bearish crossover. While this does indicate a likely move downward, the bearish momentum was low, meaning a reversal could still be possible.
The 9-MA can be seen closely following just above the price line, possibly applying further bearish pressure on the Ethereum’s value. A look at the Fibonacci retracement levels shows ETH has repeatedly tried and been unable to break above the 78.6% line at $150 over the last five days, and a break out from the pattern could have the price facing the immediate challenge of crossing the $150 mark.
Further, ETH showed improved, yet still, low success breaking below the 61.8% line, meaning a short-term move down to $146 will likely see bulls pumping the price back above the level. It seems plausible, due to ETH shuttling between the two lines over the last week, that the coin will continue through the pattern formation, possibly moving down to $146 before eventually breaking out, and moving up to $156 in the coming weeks.
The post appeared first on AMBCrypto


