Bitcoin
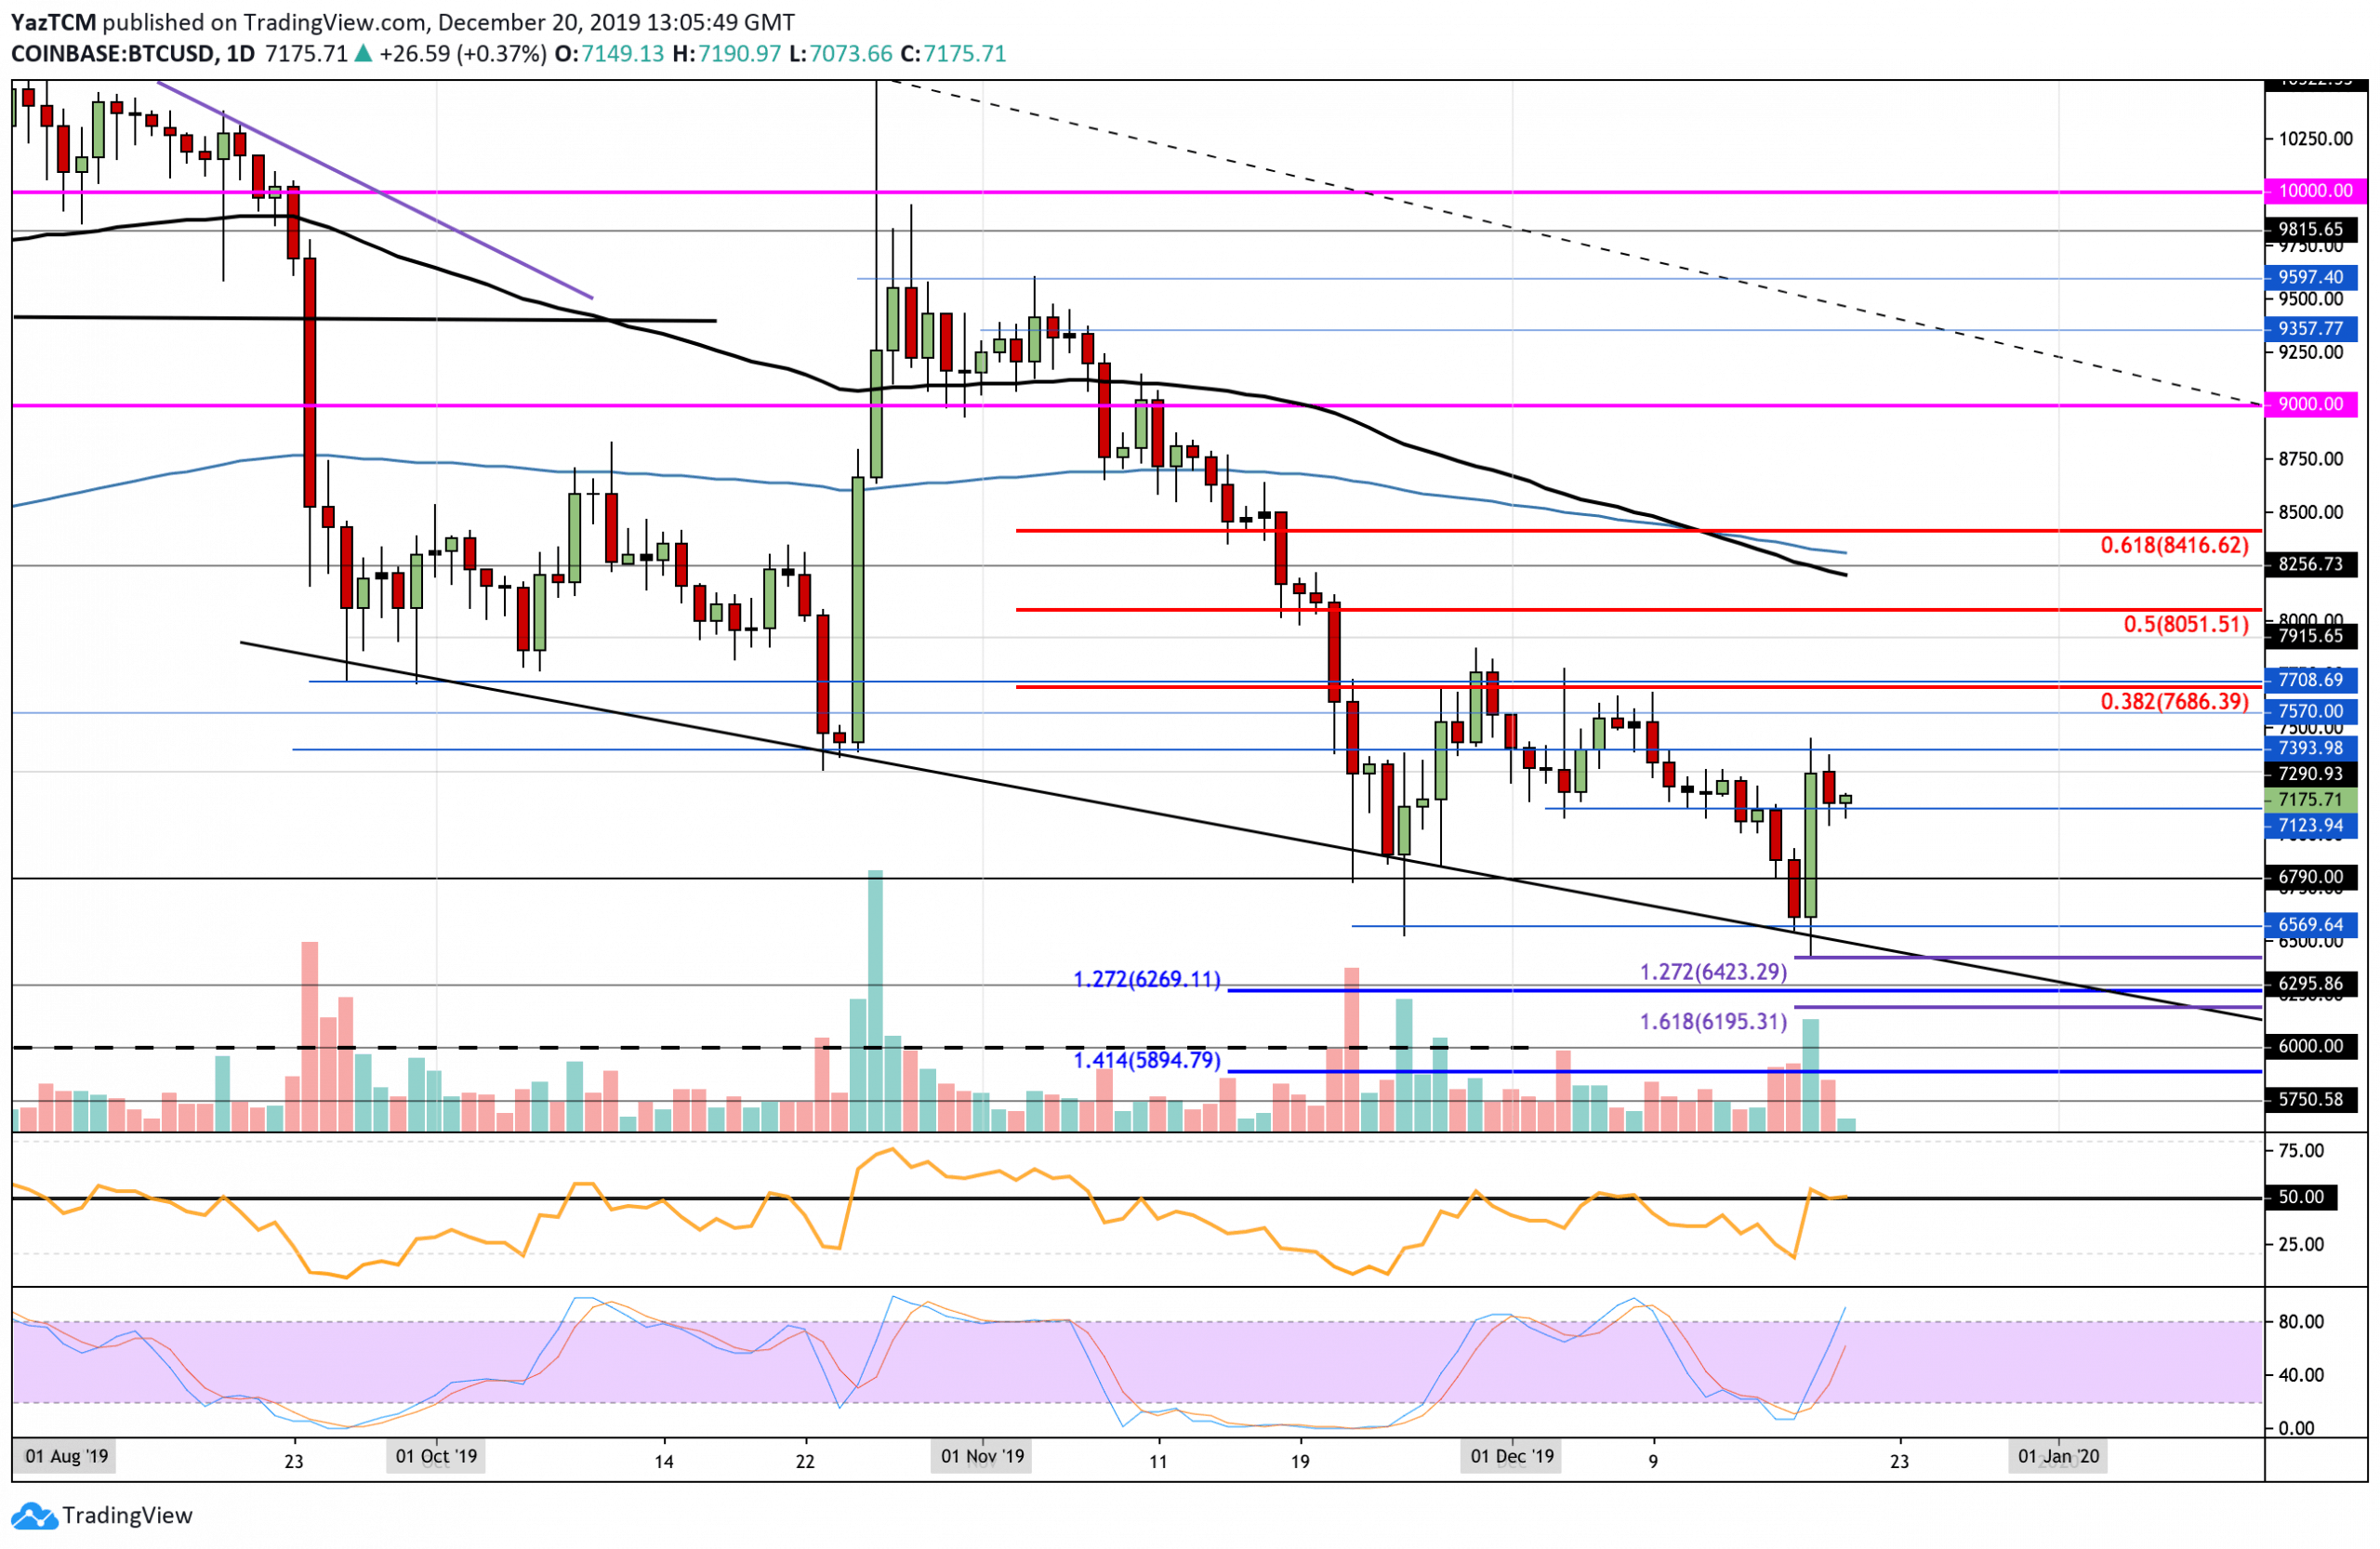
Bitcoin went through a rollercoaster of price action this week. On Monday, the cryptocurrency started to fall, and it dropped by a total of 10% by Tuesday to reach a low of $6,430. However, after that, it rebounded higher, gaining a total of 15% to climb back above the $7,000 level and reach the current support of $7,125.
If the buyers continue to drive the coin higher, an initial resistance is expected at $7,400. Above this, resistance lies at $7,686 (bearish .382 Fib Retracement), and $8,000. Alternatively, toward the downside, if the sellers push BTC beneath the support at $7,123, immediate support is expected at $7,000. Beneath this, additional support can be found at $6,790 and $6,570.
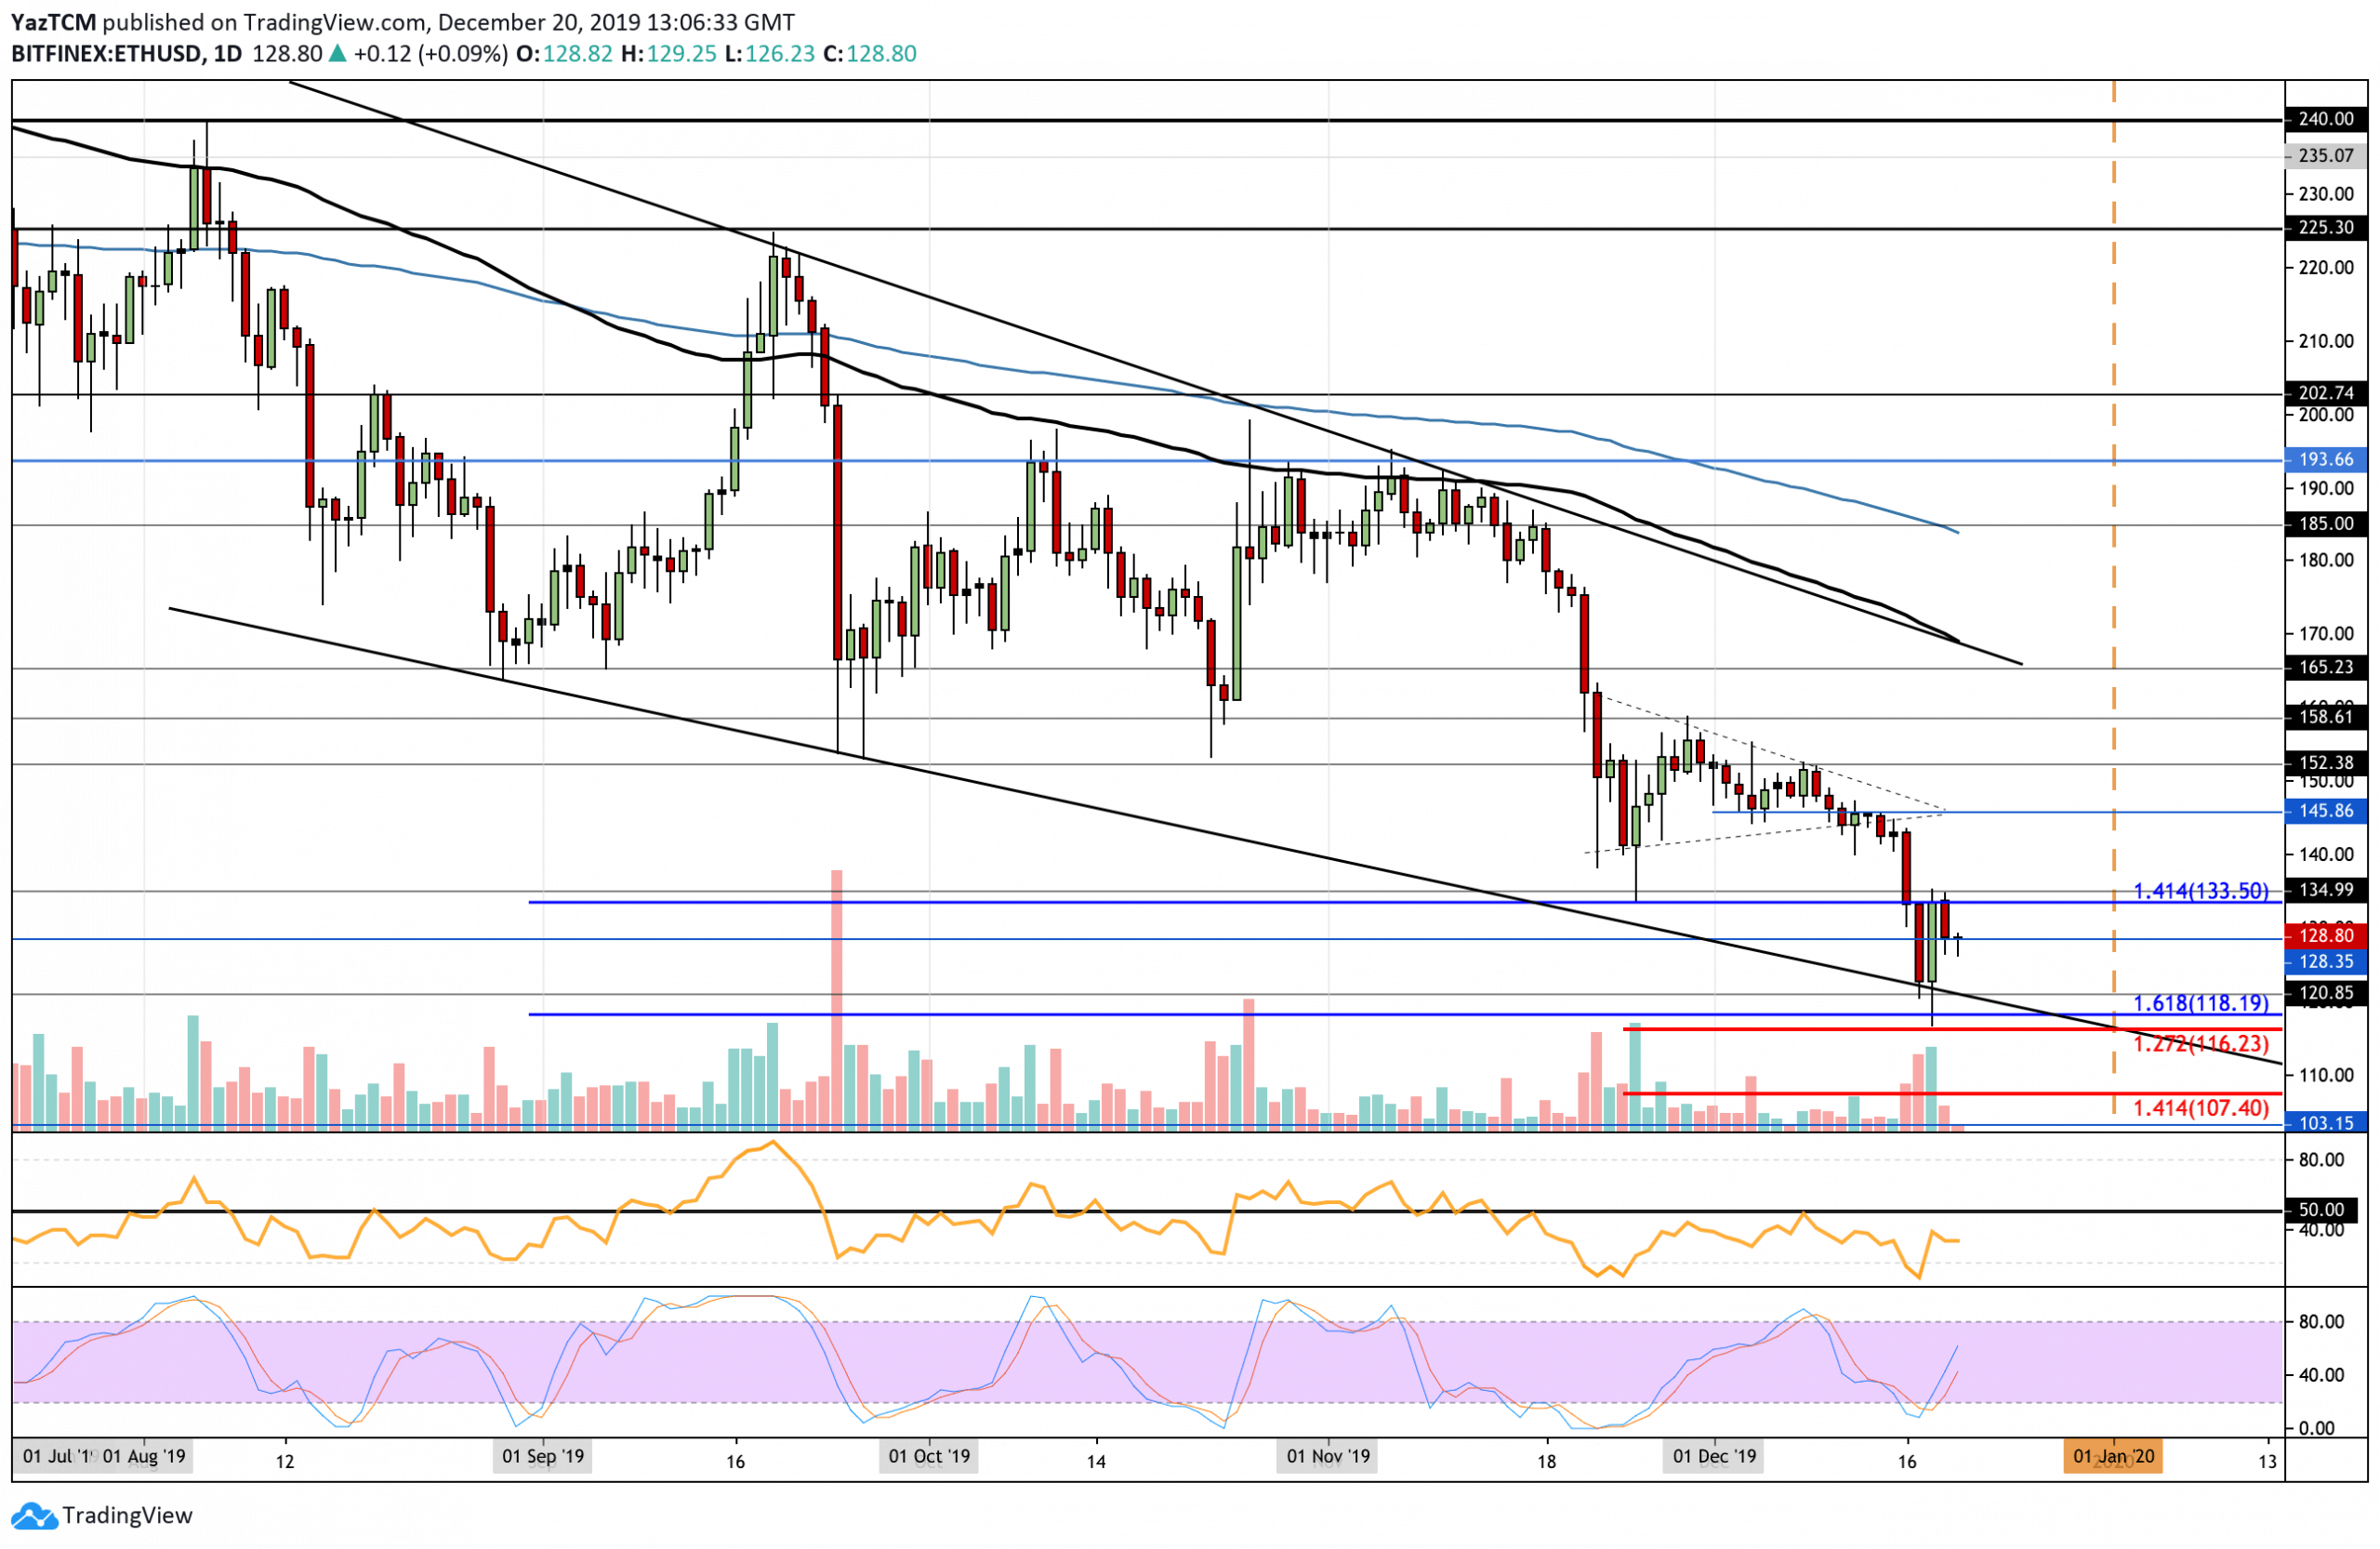
Ethereum has seen a disastrous week after dropping by a total of 11%. The cryptocurrency fell beneath the acute symmetrical triangle and started to plummet. It continued to drop until reaching support at the lower boundary of the descending channel. More specifically, ETH found strong support at $118, which is provided by the downside 1.618 Fib Extension. ETH rebounded higher from here but was unable to overcome resistance at $133.50.
Looking ahead, if the bulls continue to rise above $133.50, higher resistance is located at $145, $152, and $165 (100-days EMA). On the other hand, if the sellers drop ETH beneath the current level of $128, support is found at $120, the lower boundary of the channel, $118, and $116.23.
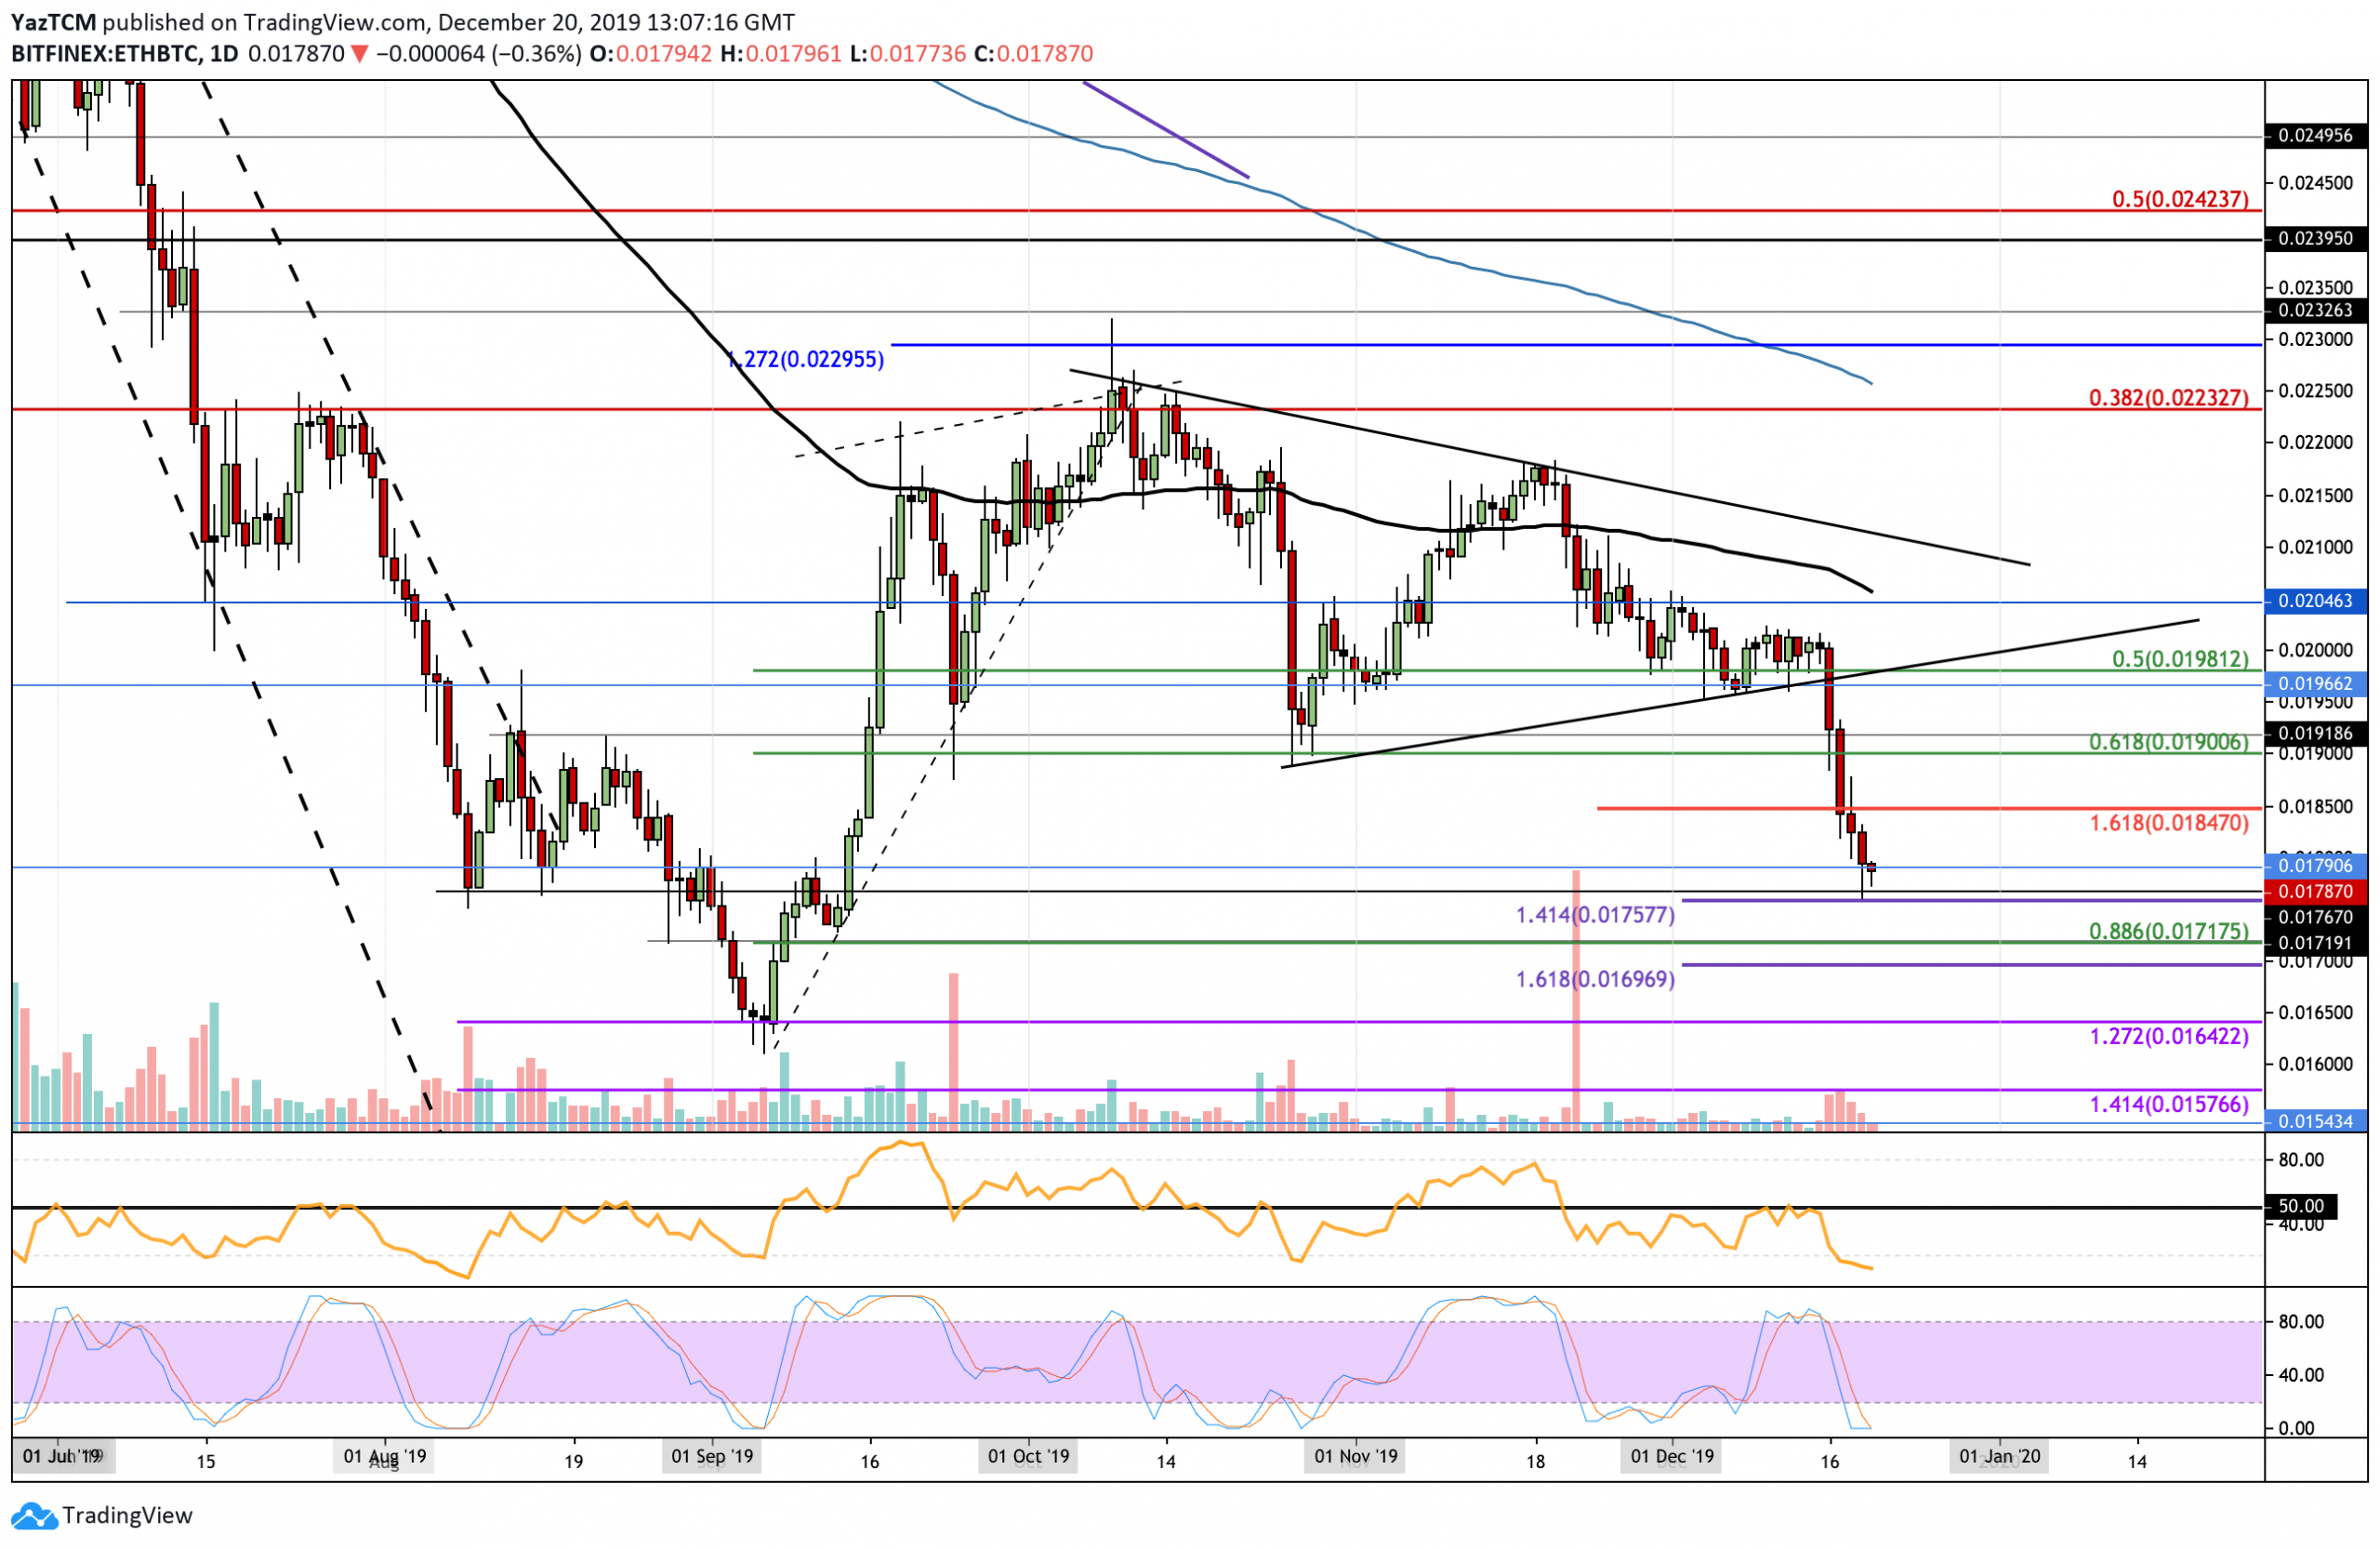
Against Bitcoin, Ethereum tumbled beneath the previous symmetrical triangle pattern and started to plummet. The cryptocurrency continued to drop beneath support at 0.019 BTC, 0.0185 BTC, and 0.018 BTC until reaching at 0.0175 BTC (downside 1.414 Fibonacci Extension level). ETH rebounded higher from here as it sits at 0.0178 BTC.
If the bears continue to drop the market lower, immediate support is found at 0.0175 BTC. Beneath this, support lies at 0.0171 BTC (.886 Fib Retracement), 0.0169 BTC, and 0.0164 BTC (September lows). On the other hand, if the bulls climb higher, initial resistance can be found at 0.0185 BTC. Above this, resistance lies at 0.019 BTC and 0.20 BTC.
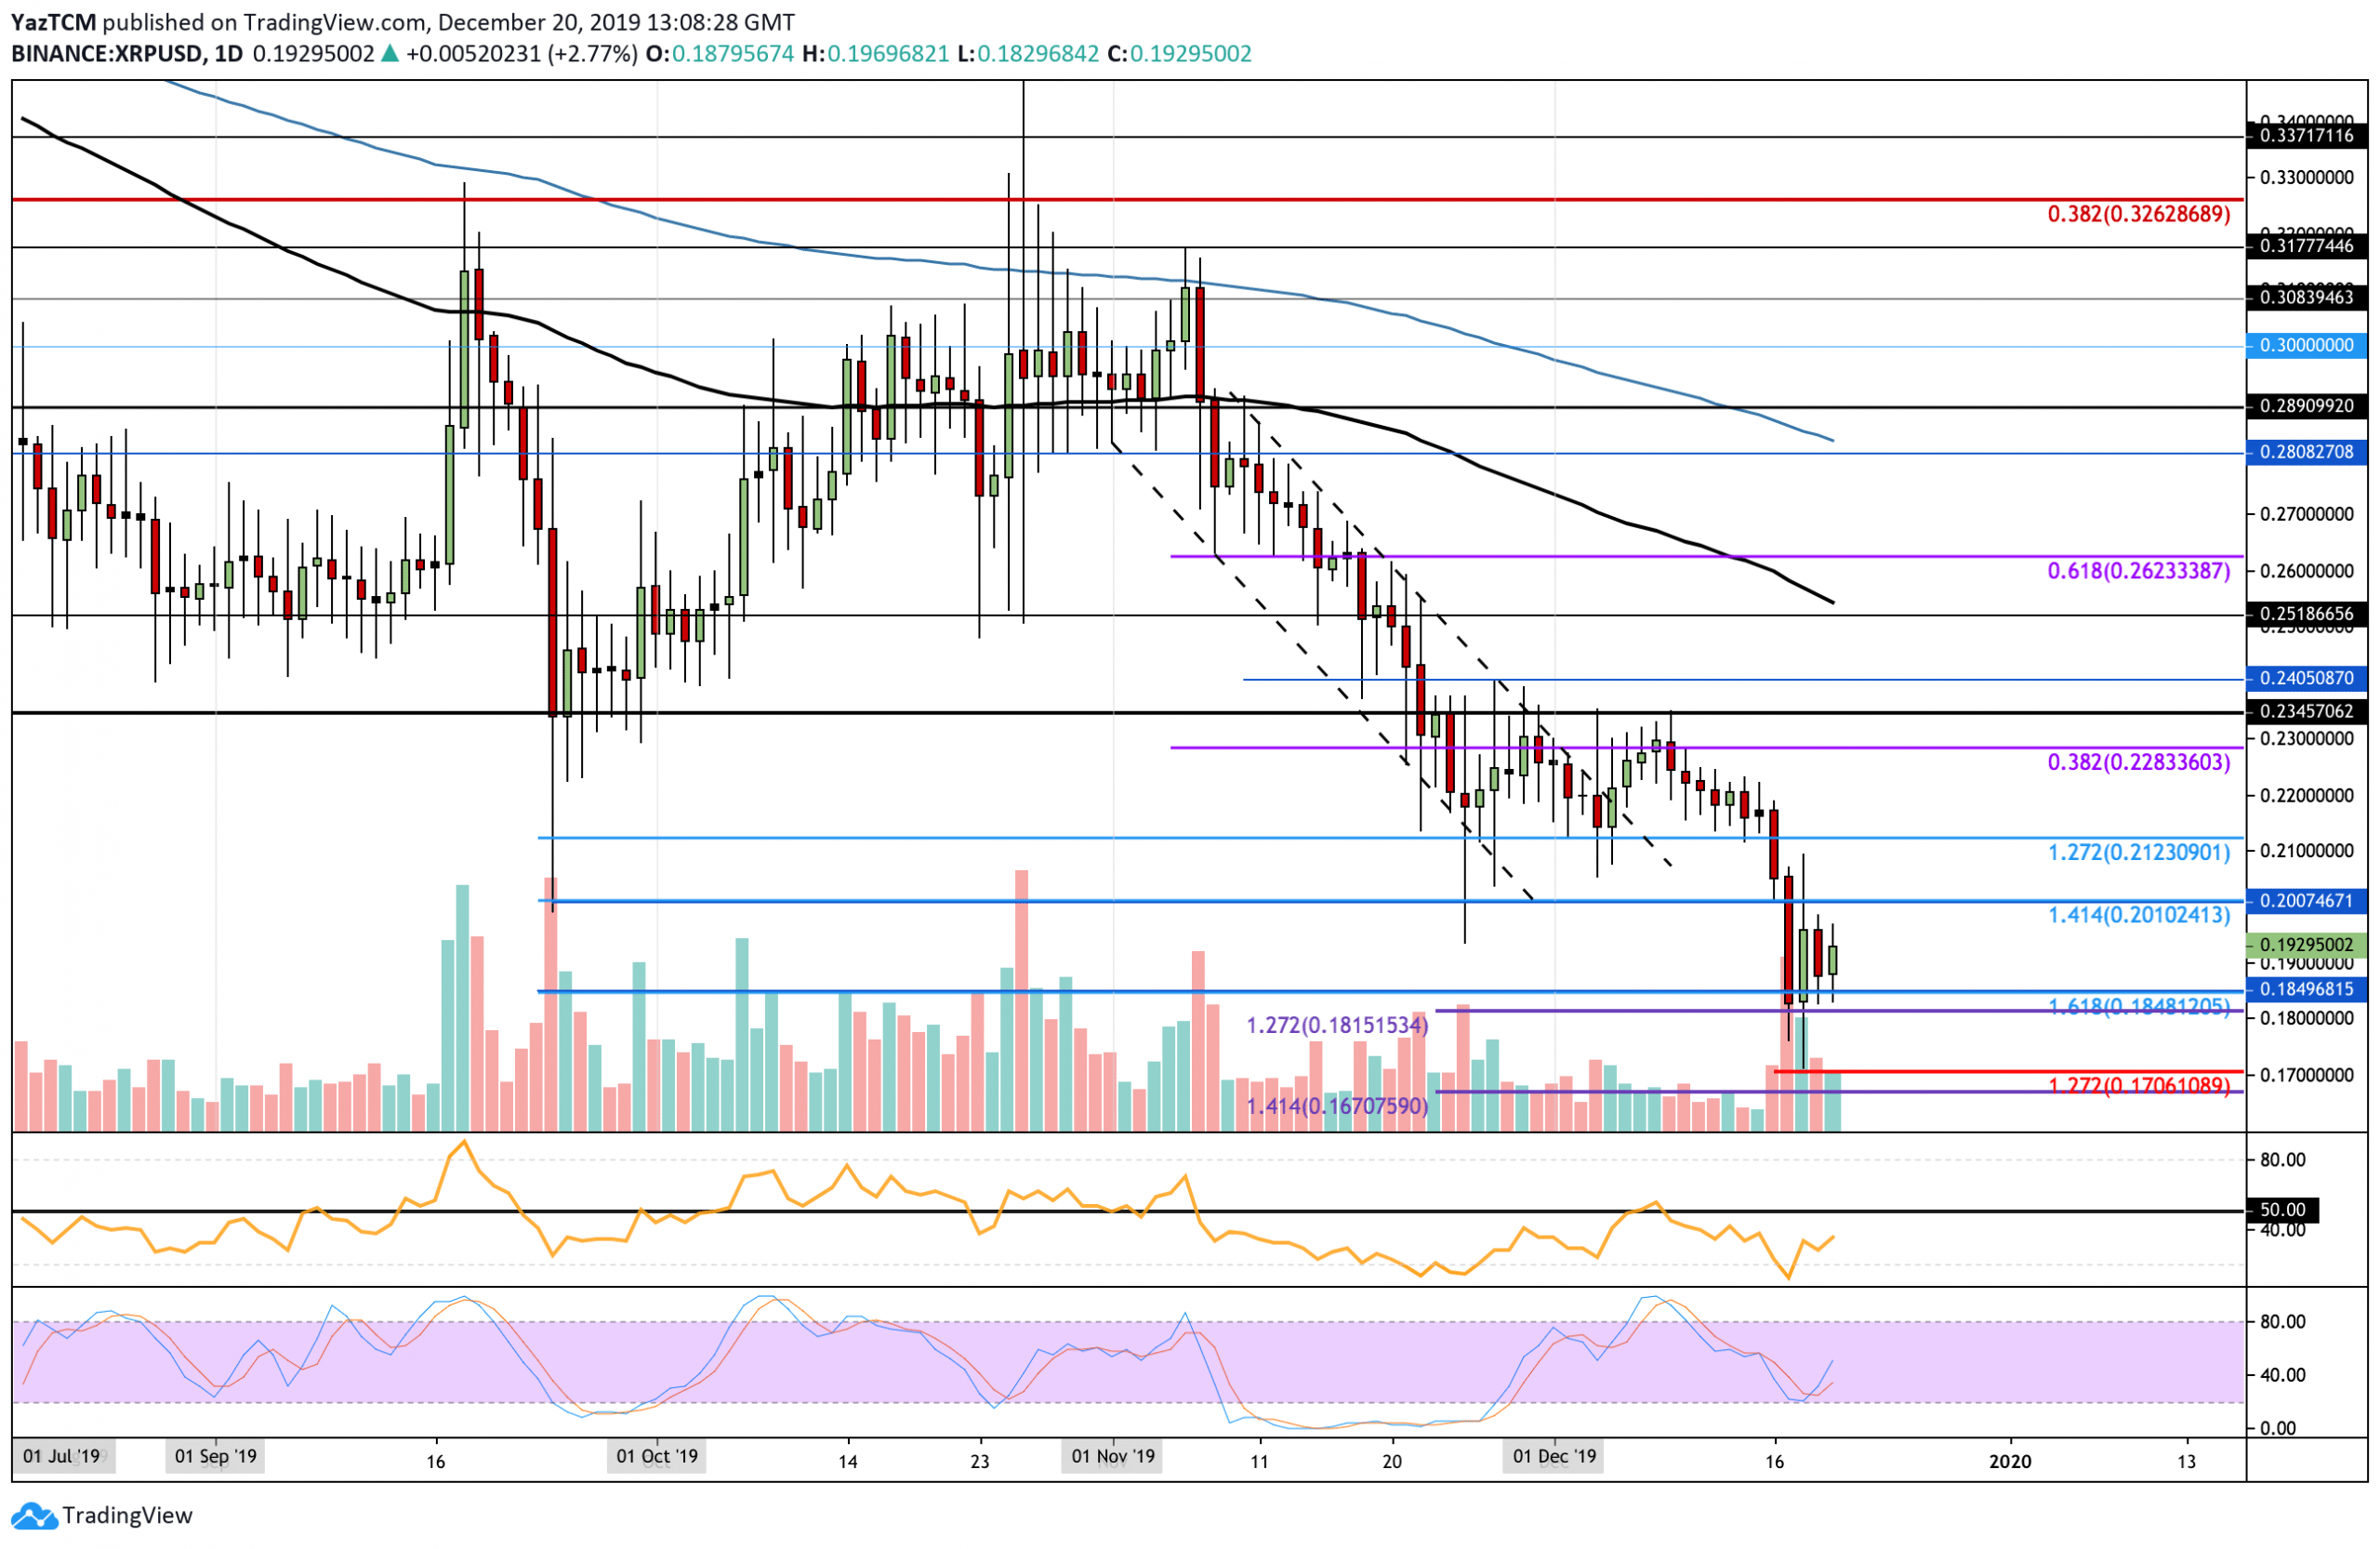
This week saw XRP collapsing beneath the strong support at $0.21 as it continued to drop by a considerable 13% to reach a low of $0.18 as it created fresh multi-year lows. The cryptocurrency managed to find support at a downside 1.618 Fib Extension, which allowed it to bounce higher to where it now trades at $0.1930.
Looking ahead, if the buyers push the market, higher initial resistance is located at $0.20. Above this, resistance lies at $0.2120 and $0.2280. Alternatively, if the sellers drive XRP lower, strong support can be expected at $0.18. Beneath this, support lies at $0.17 and $0.167.
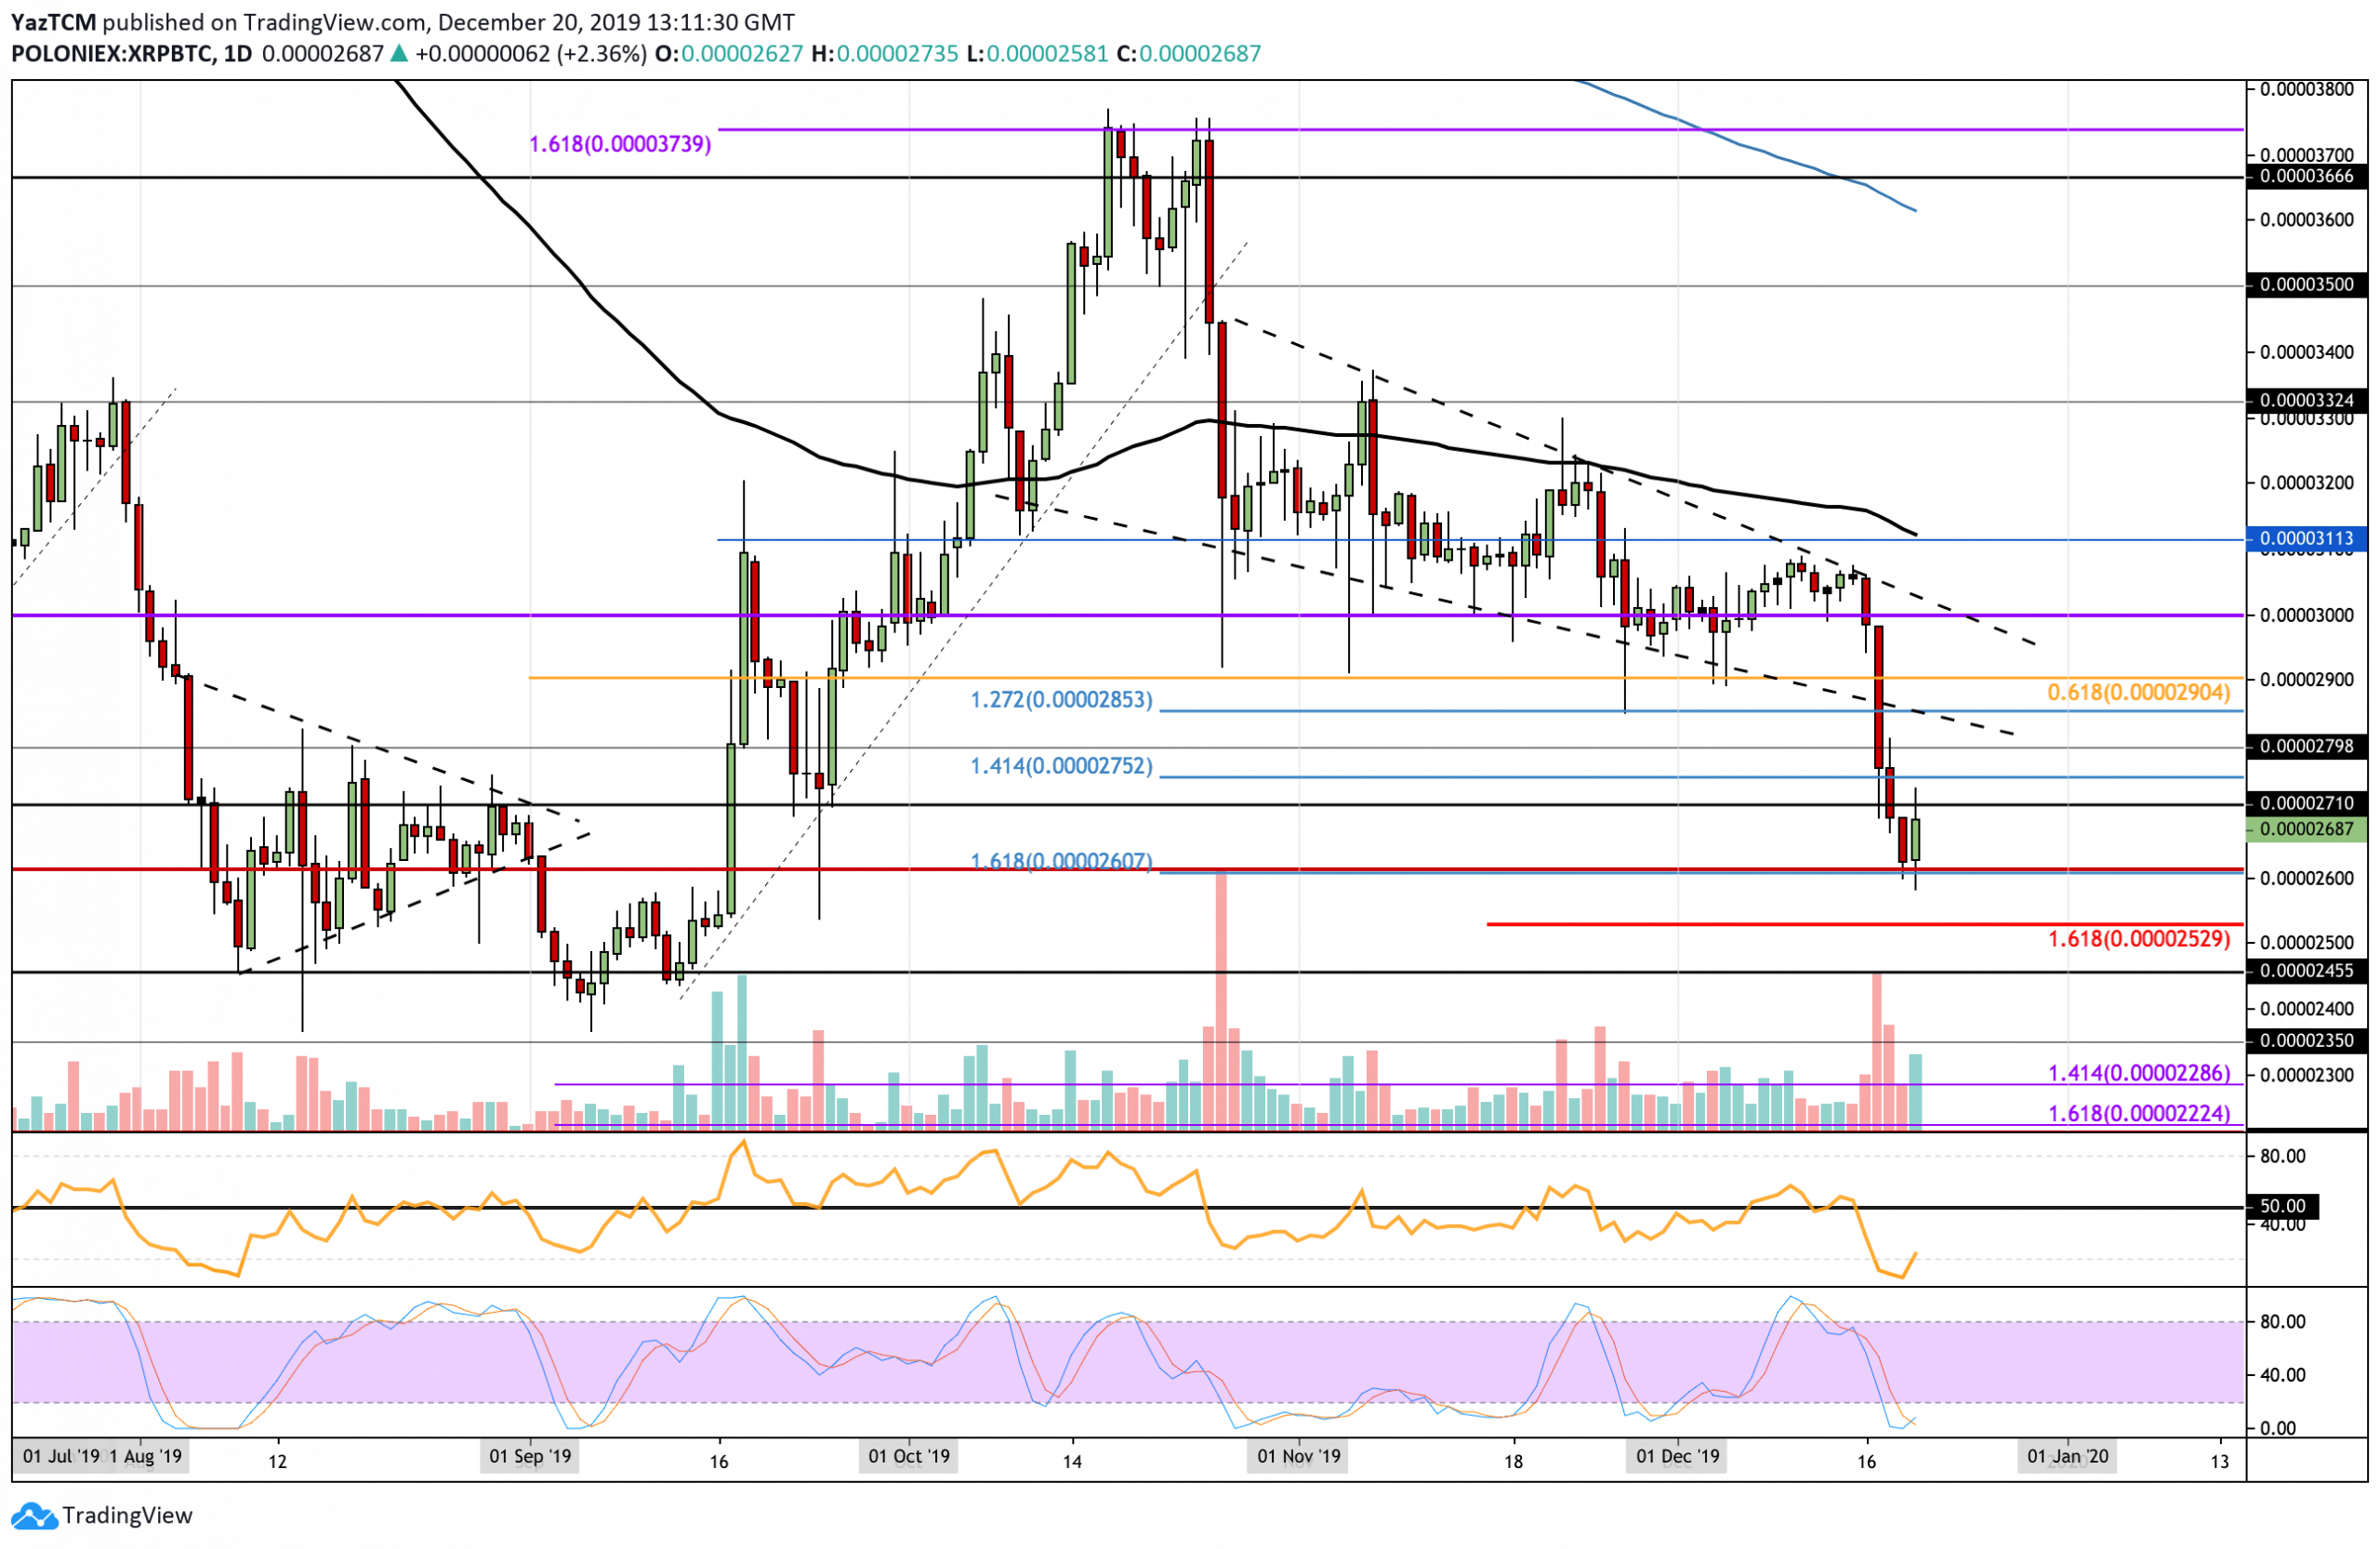
Against BTC, XRP finally dropped beneath the 3000 SAT support level and started to fall. The cryptocurrency penetrated beneath the lower boundary of the previous wedge as it slipped much lower into support at 2600 SAT. XRP has since rebounded from here as it attempts to break 2700 SAT resistance.
If the buyers can break above 2700 SAT, higher resistance lies at 2800 SAT, 2900 SAT, and 3000 SAT. Toward the downside, initial support is expected at 2600 SAT. Beneath this, additional support is located at 2530 SAT, 2455 SAT, and 2350 SAT.
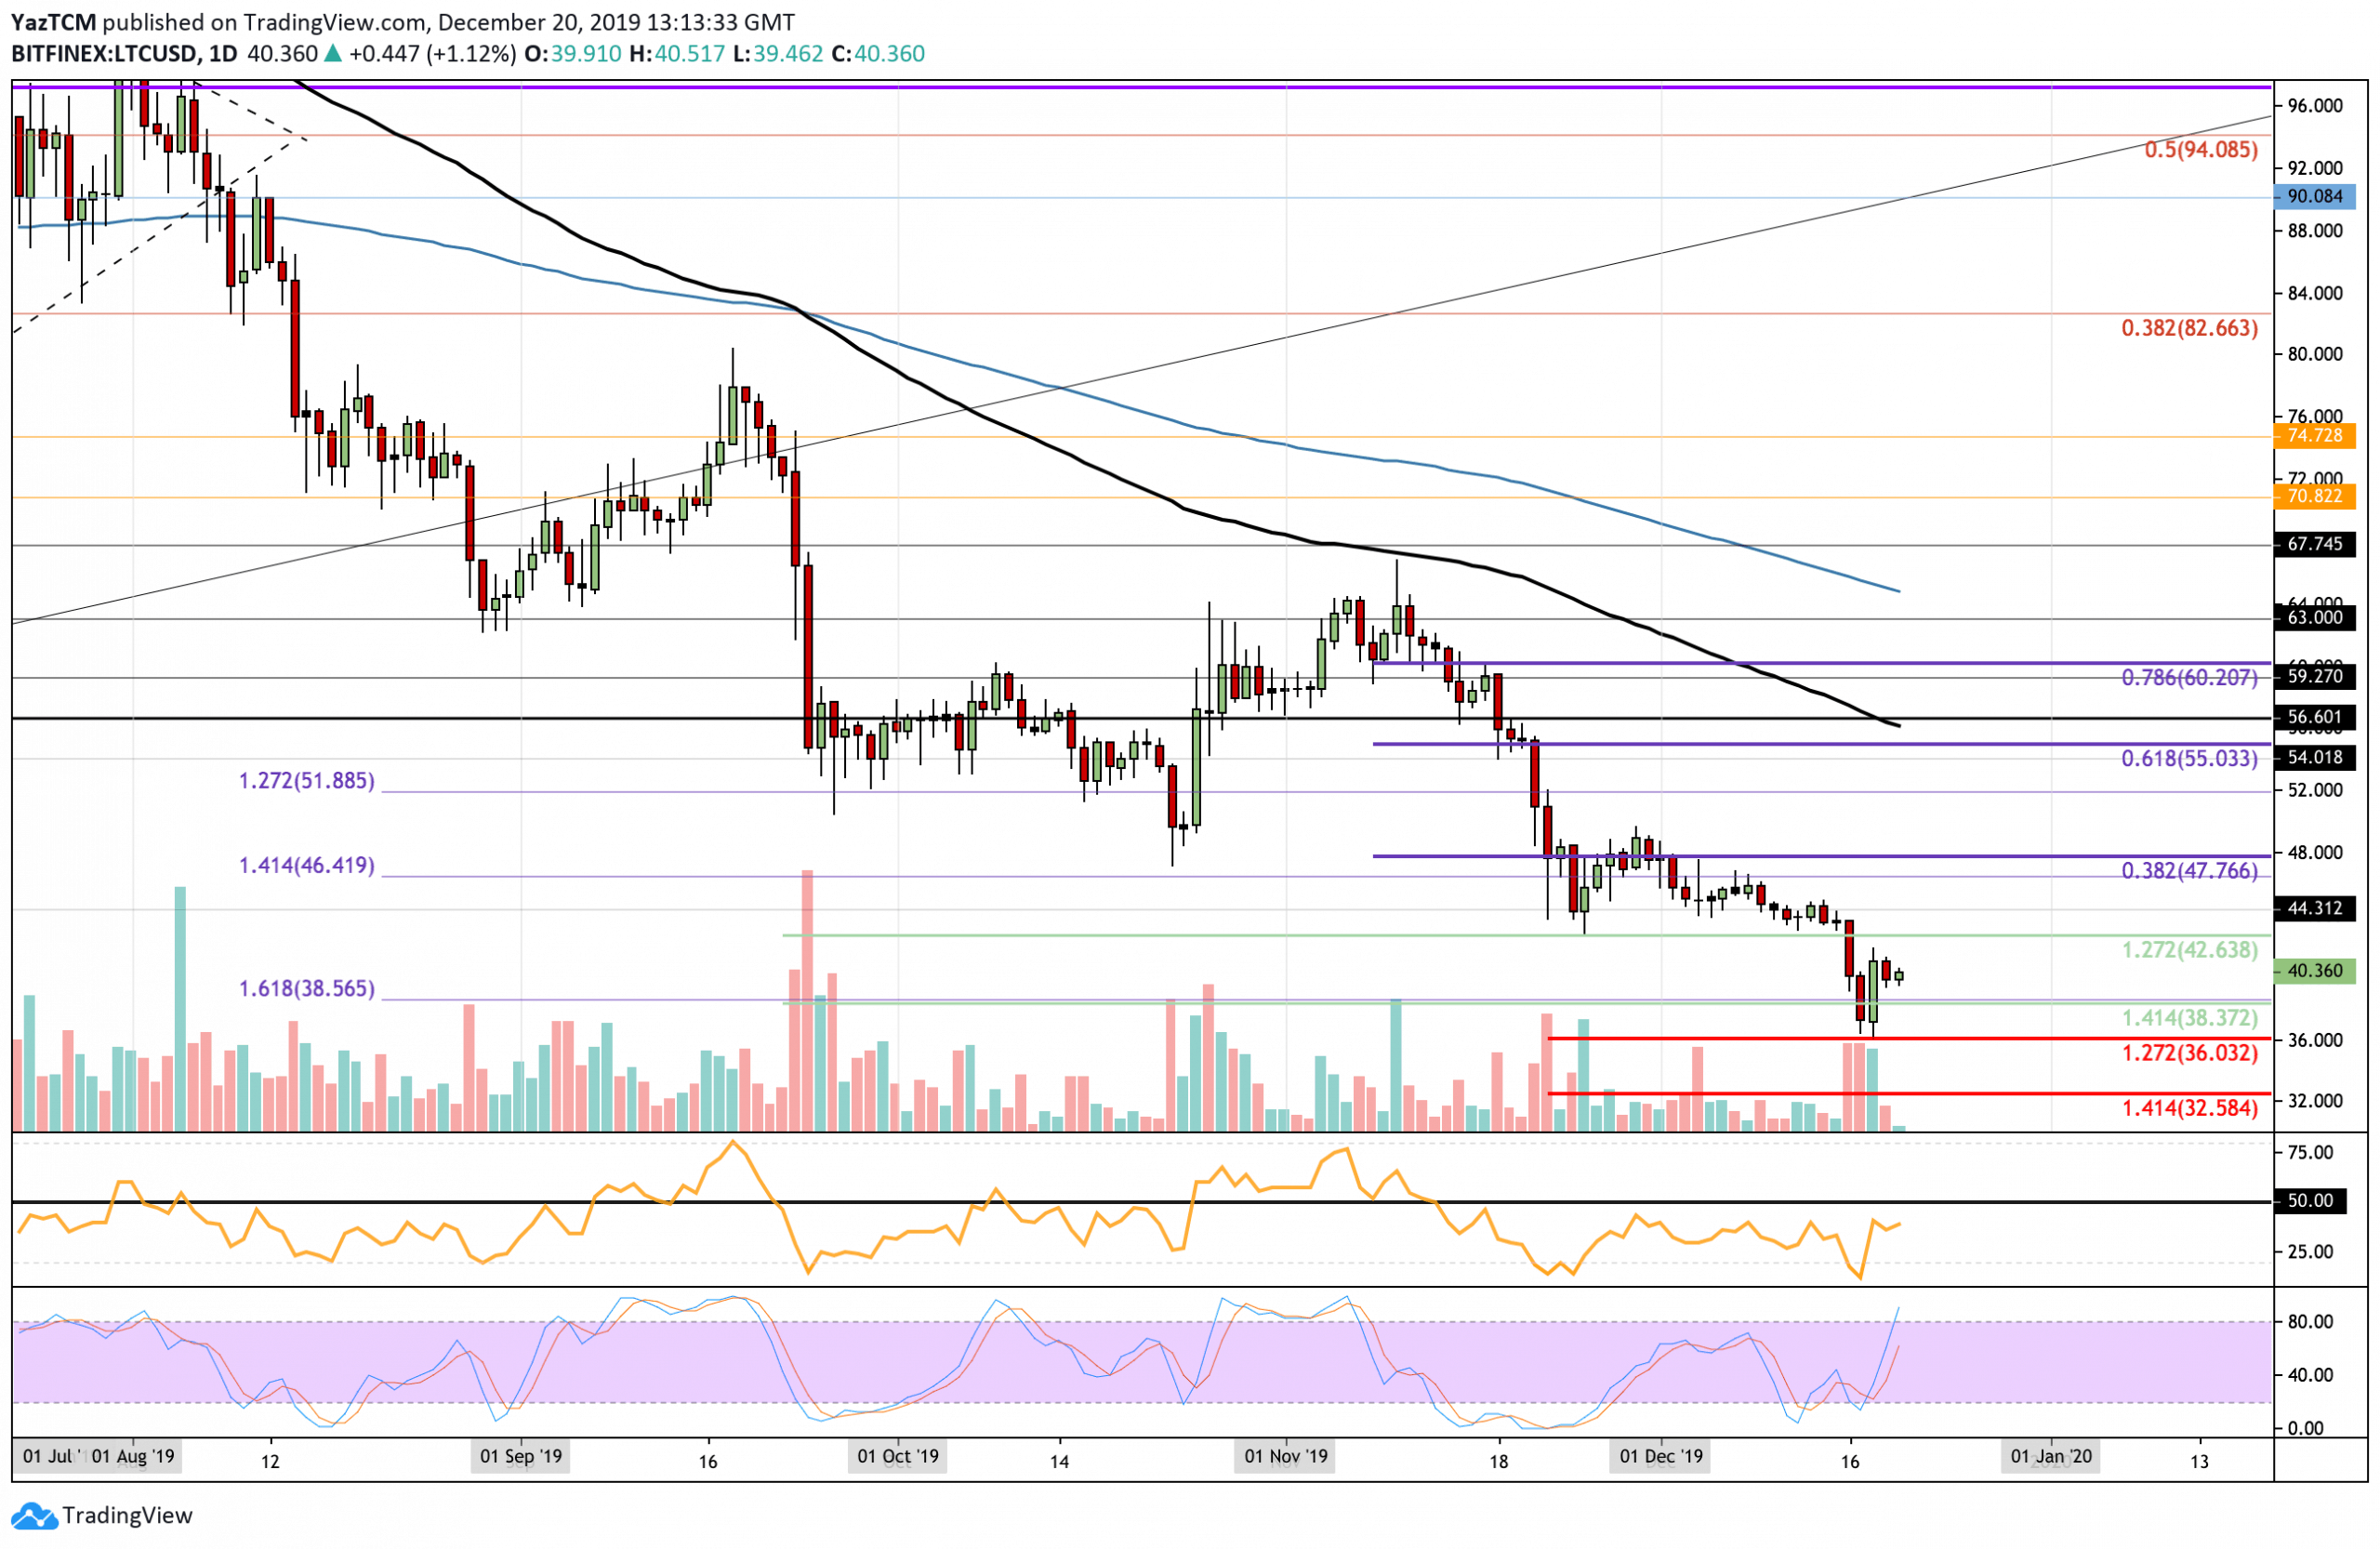
Similar to the rest of the top altcoins, Litecoin suffered an 8.55% beat down this week, causing it to drop beneath the $40 level. The coin dropped as low as $36 before support was found, allowing it to rebound higher back above the $40 level where it currently trades.
Looking ahead, if the bulls continue to drive higher initial resistance is expected at $42.63. Above this, higher resistance lies at $45, $47.76 (bearish .382 Fib Retracement), and $52. On the other hand, if the sellers push the market lower, immediate support can be found at $38.37 and $36 (downside 1.272 Fibonacci Extension level). If the bears push beneath this, additional support is found at $35 and $32.58.
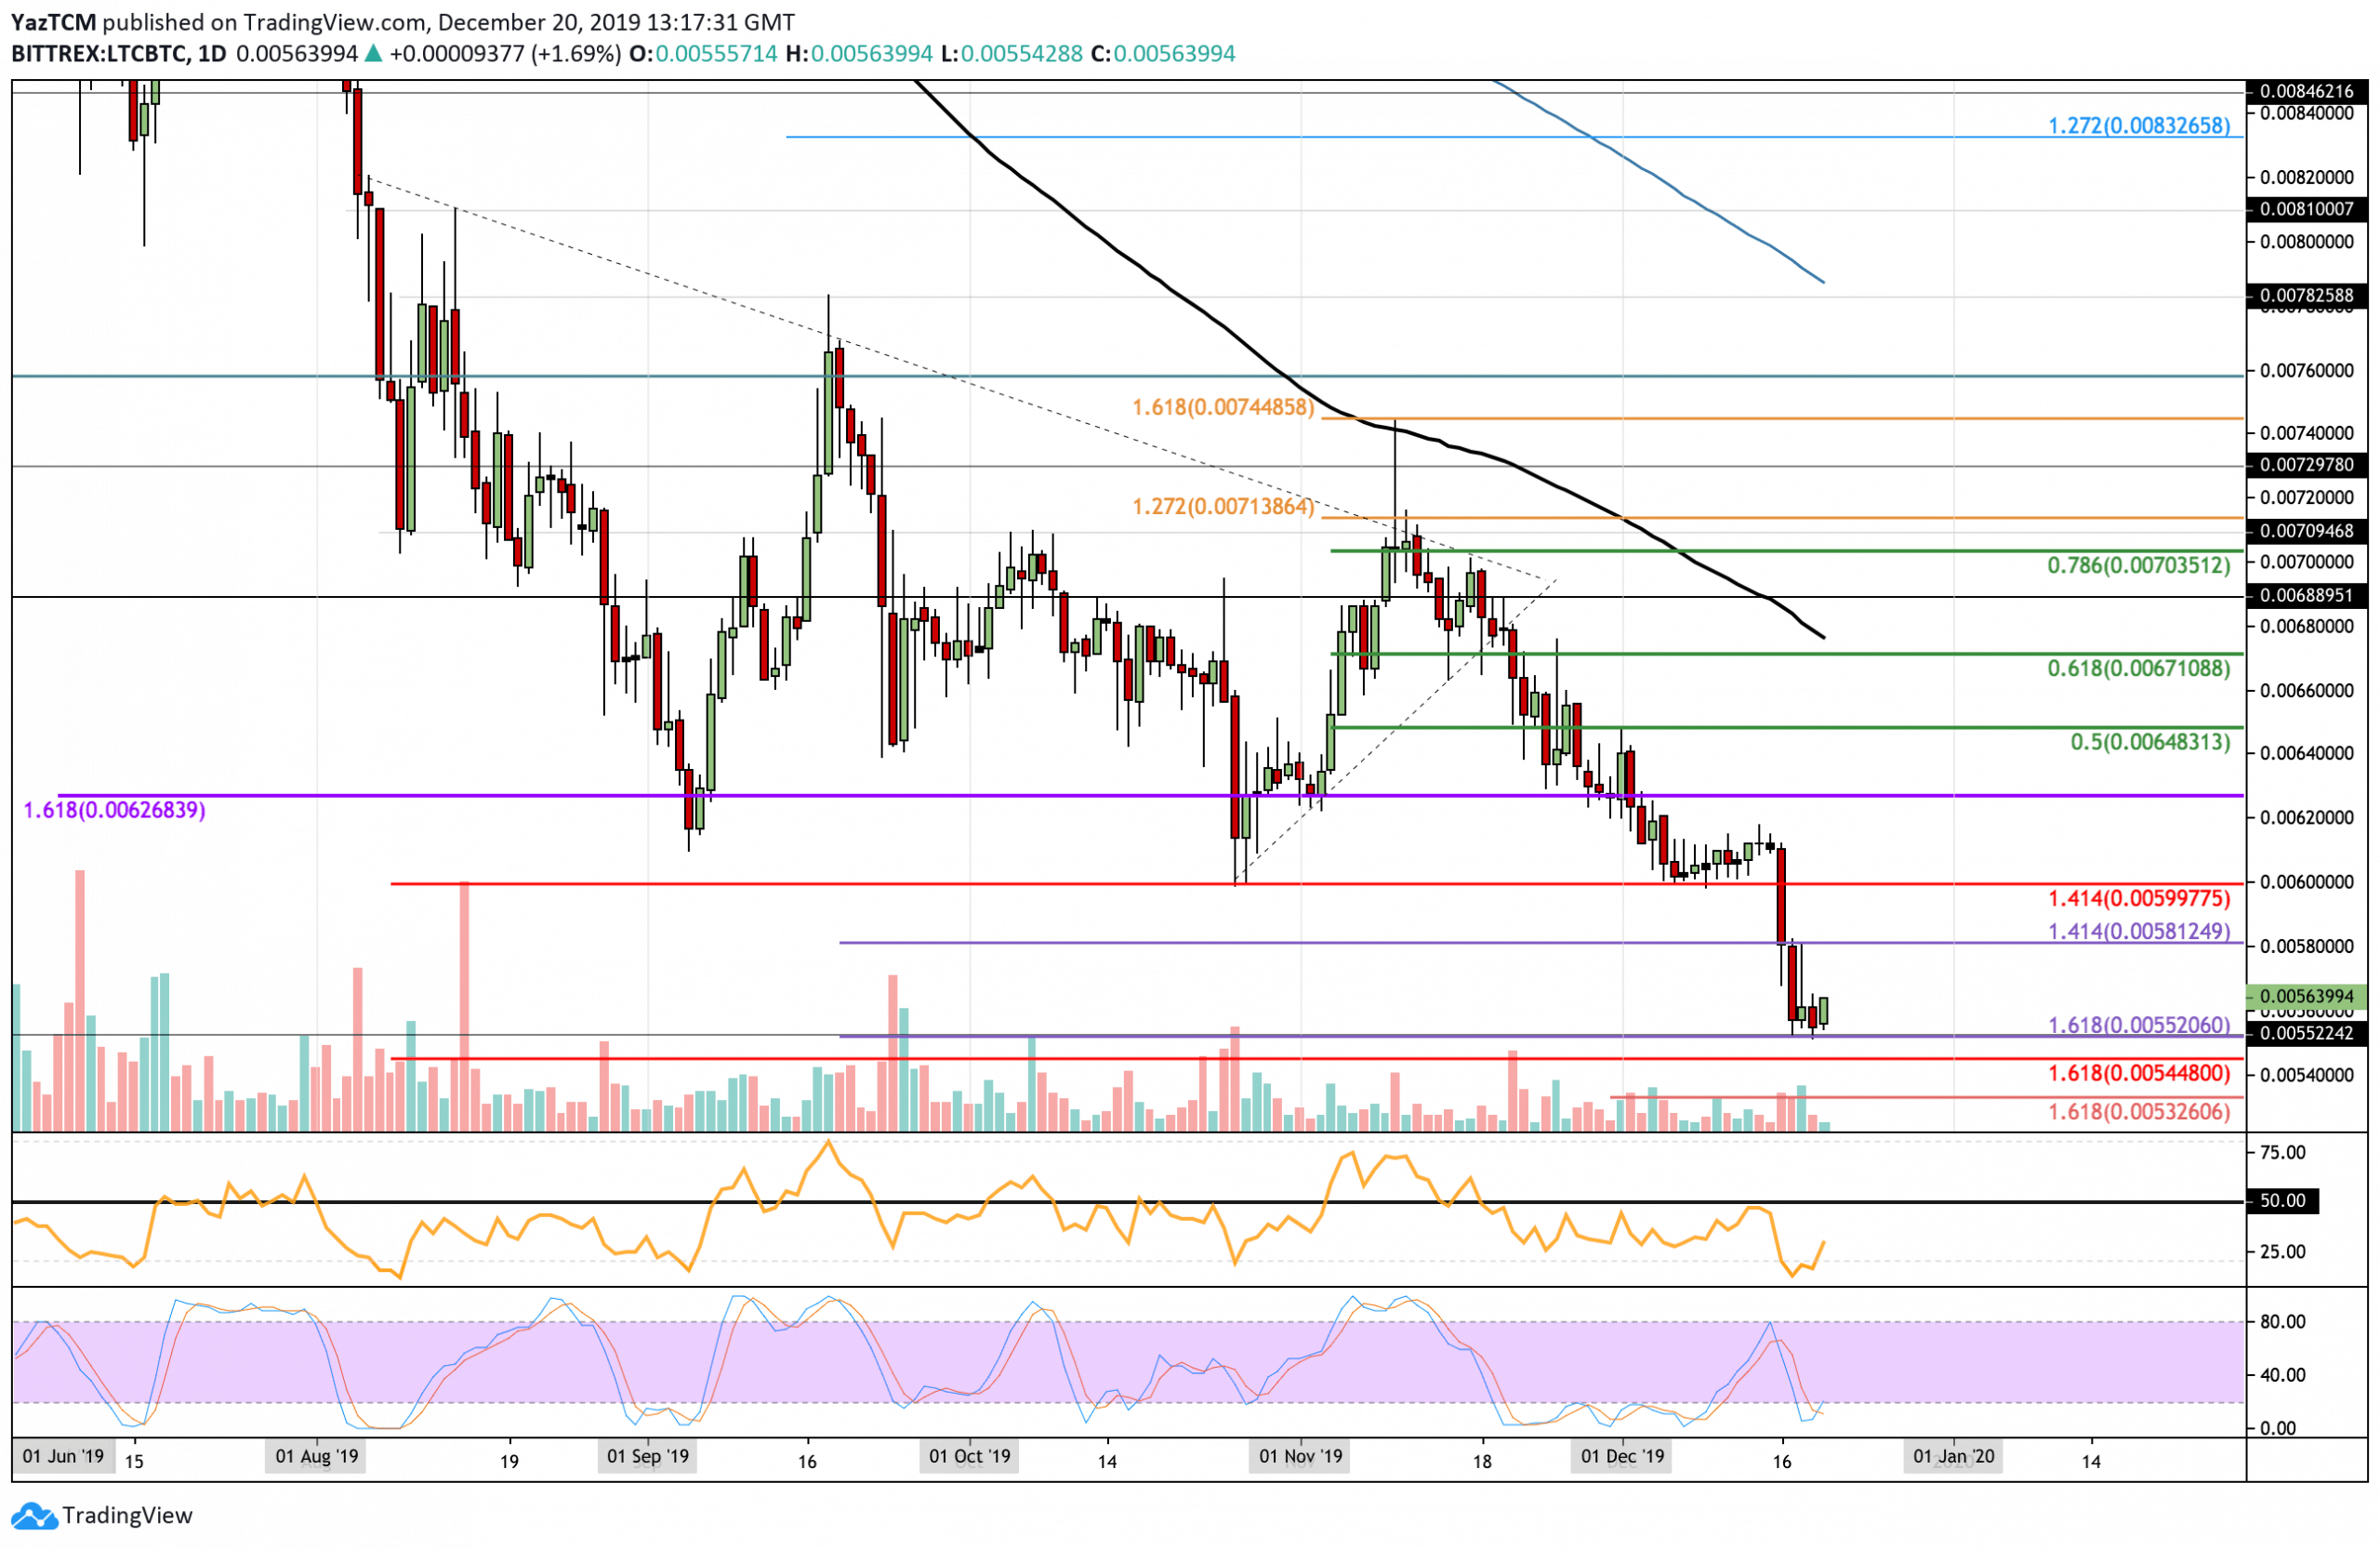
Against Bitcoin, LTC has also suffered in December. The cryptocurrency collapsed beneath the support at 0.006 BTC, causing it to drop much lower into support at 0.0055 BTC (downside 1.618 Fibonacci Extension level). Litecoin has since bounced higher as it trades at 0.0056 BTC.
If the buyers continue to push LTC higher against BTC, immediate resistance is to be expected at 0.0058 BTC. Above this, resistance lies at 0.006 BTC and 0.0064 BTC (bearish .5 Fibonacci Retracement). On the other hand, if the sellers push the market lower, support can be expected at 0.0055 BTC. Beneath this, support is located at 0.0054 BTC and 0.0053 BTC.
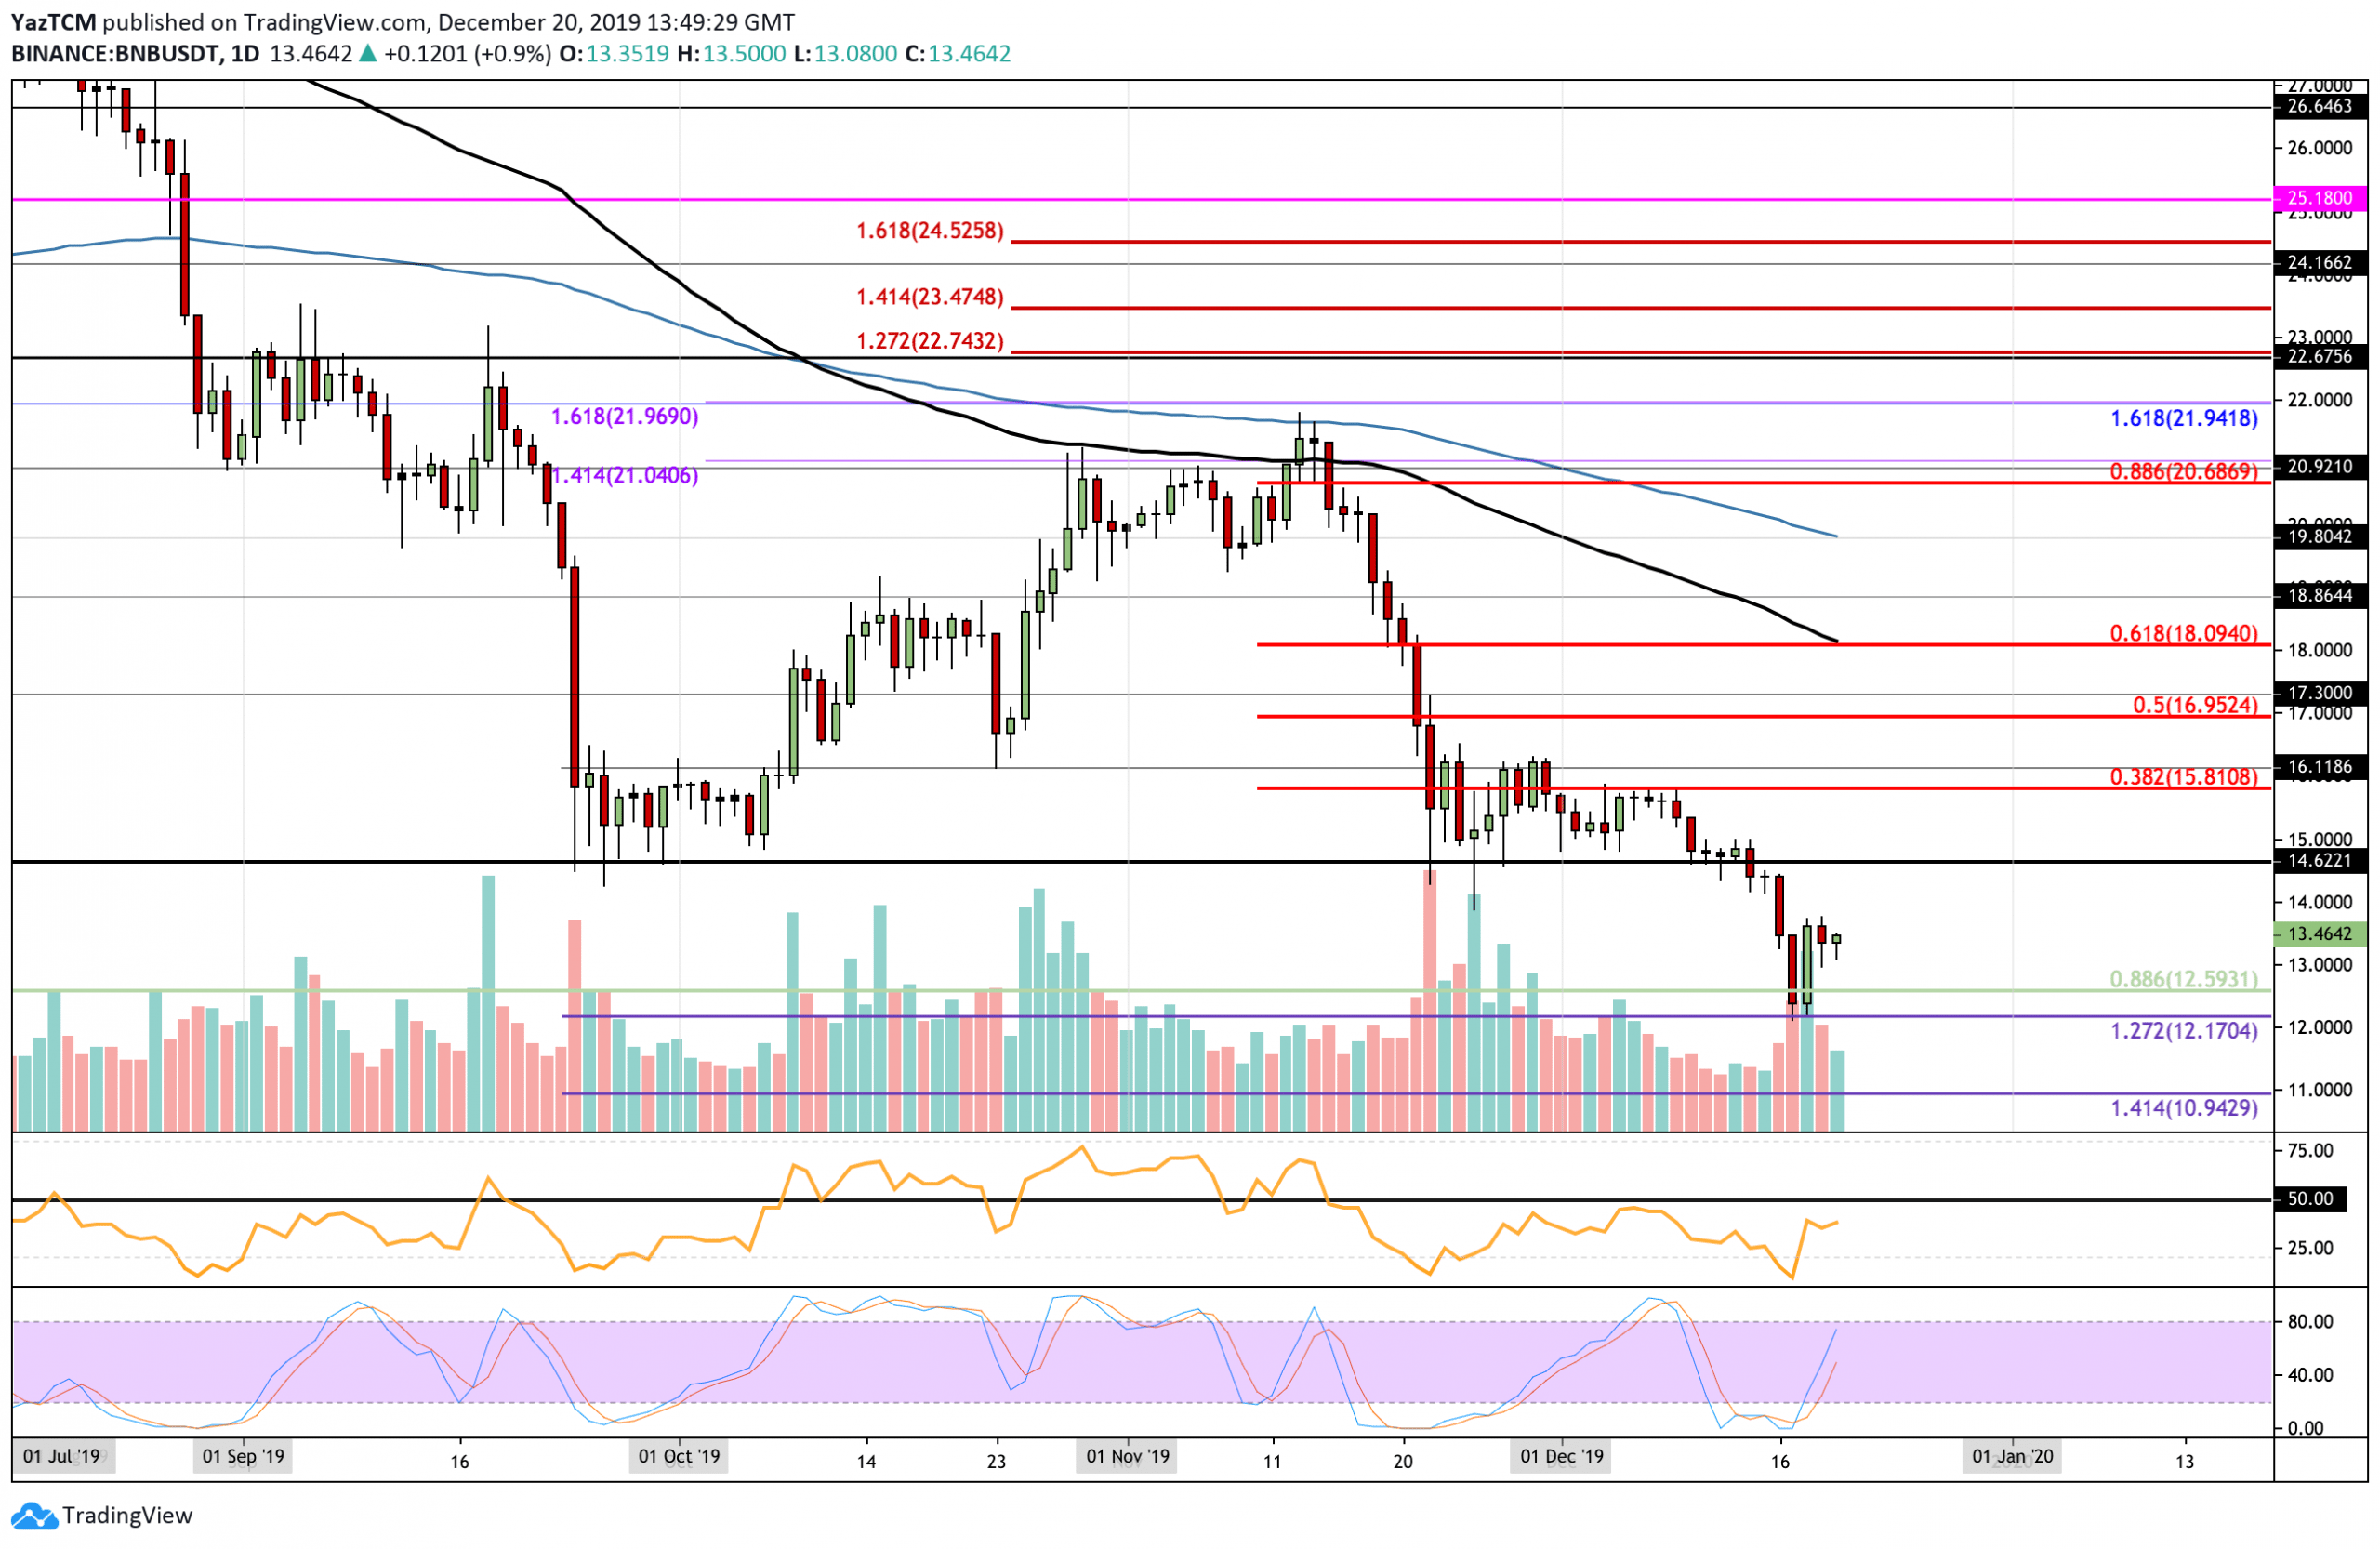
Binance Coin saw a 9% price fall this week, causing it to drop to the current $13.46 level. It was pushed further beneath this but managed to find support at $12.17, which allowed BNB to bounce higher.
If the bulls can continue with the rebound, an initial resistance is expected at $14.62 and $15.81 (bearish .382 Fib Retracement). Beyond this, resistance is located at $18.09 (bearish .618 Fib Retracement & 100-days EMA). Toward the downside, support can be found at $12.59 and $12.17 (downside 1.272 Fib Extension). Beneath this, support lies at $11.50 and $10.94.
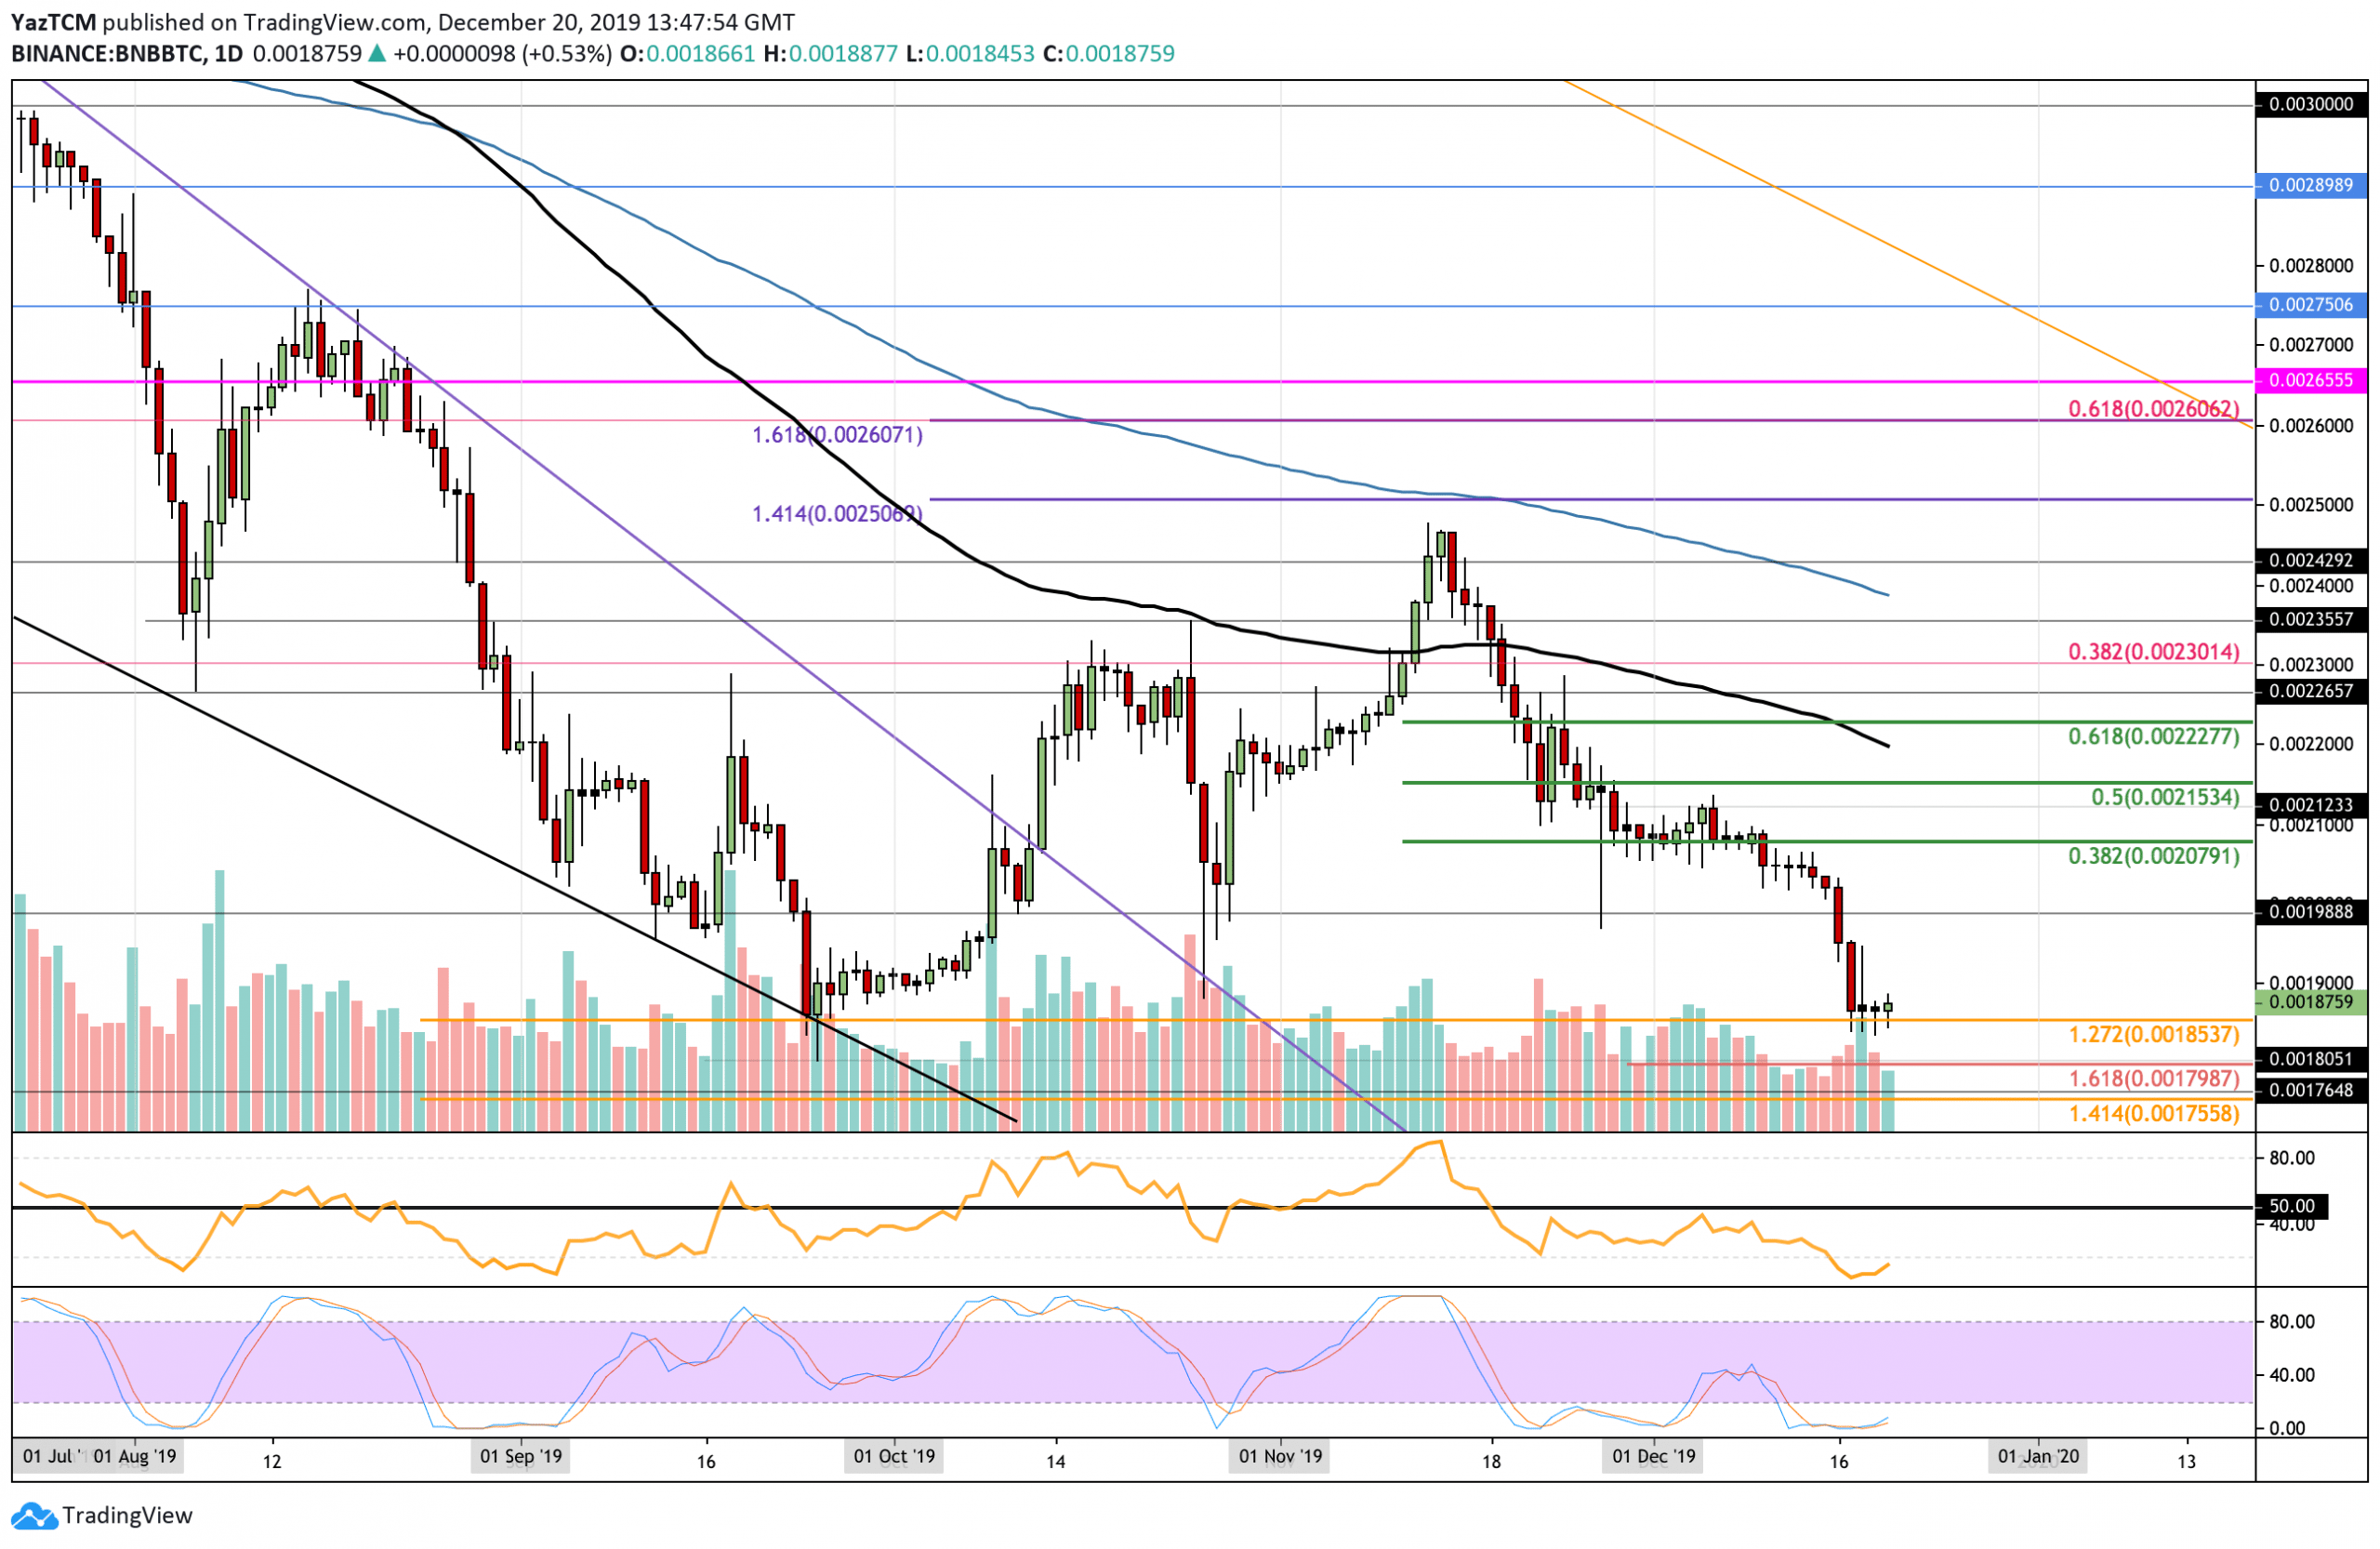
Against BTC, BNB fell further lower, dropping beneath the support at 0.002 BTC and plummeting into lower support at 0.00185 BTC. This level provided strong support for the market during September and is expected to provide an equal level of support moving forward.
Looking ahead, if the bulls can bounce higher, the first level of resistance is located at 0.002 BTC. Beyond 0.002 BTC, resistance is expected at 0.00207 BTC (bearish .382 Fib Retracement), 0.00215 BTC (bearish .5 Fib Retracement), and 0.0022 BTC (100-days EMA). Alternatively, if the sellers push the market lower, the support at 0.00185 BTC should hold. If it drops beneath this, additional support can be found at 0.0018 BTC and 0.00175 BTC.
Disclaimer: Information found on CryptoPotato is those of writers quoted. It does not represent the opinions of CryptoPotato on whether to buy, sell, or hold any investments. You are advised to conduct your own research before making any investment decisions. Use provided information at your own risk. See Disclaimer for more information.
Cryptocurrency charts by TradingView.
Technical analysis tools by Coinigy.
You might also like:
The post appeared first on CryptoPotato


