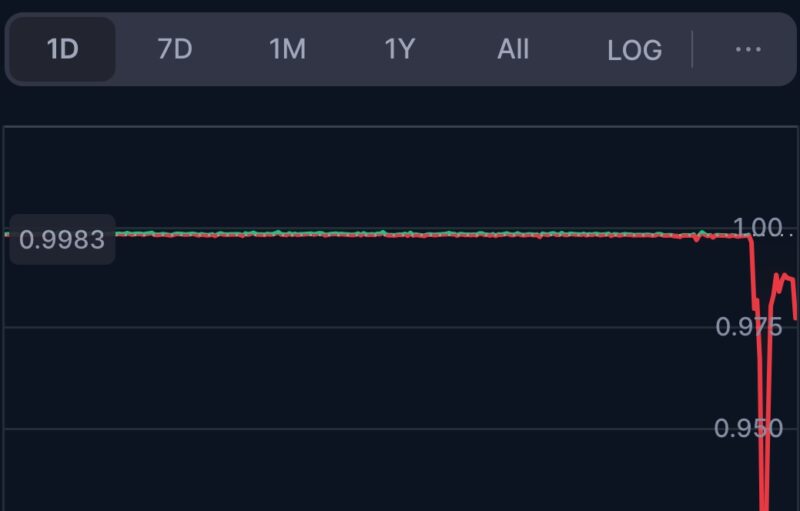
After touching a low of $0.175 on December 18, XRP’s performance over the rest of 2019 seems much more digestible. For the period between January and April, XRP consolidated between $0.30 and $0.32, only to rise to $0.50 by June. The coin has been on a steady decline since then, with only a couple of brief encounters above the $0.30 mark.
Valued at $0.188 at the time of writing, XRP’s long-term prospects seem uncertain at this point in time.
XRP 1-day chart
Source: XRPUSD on TradingView
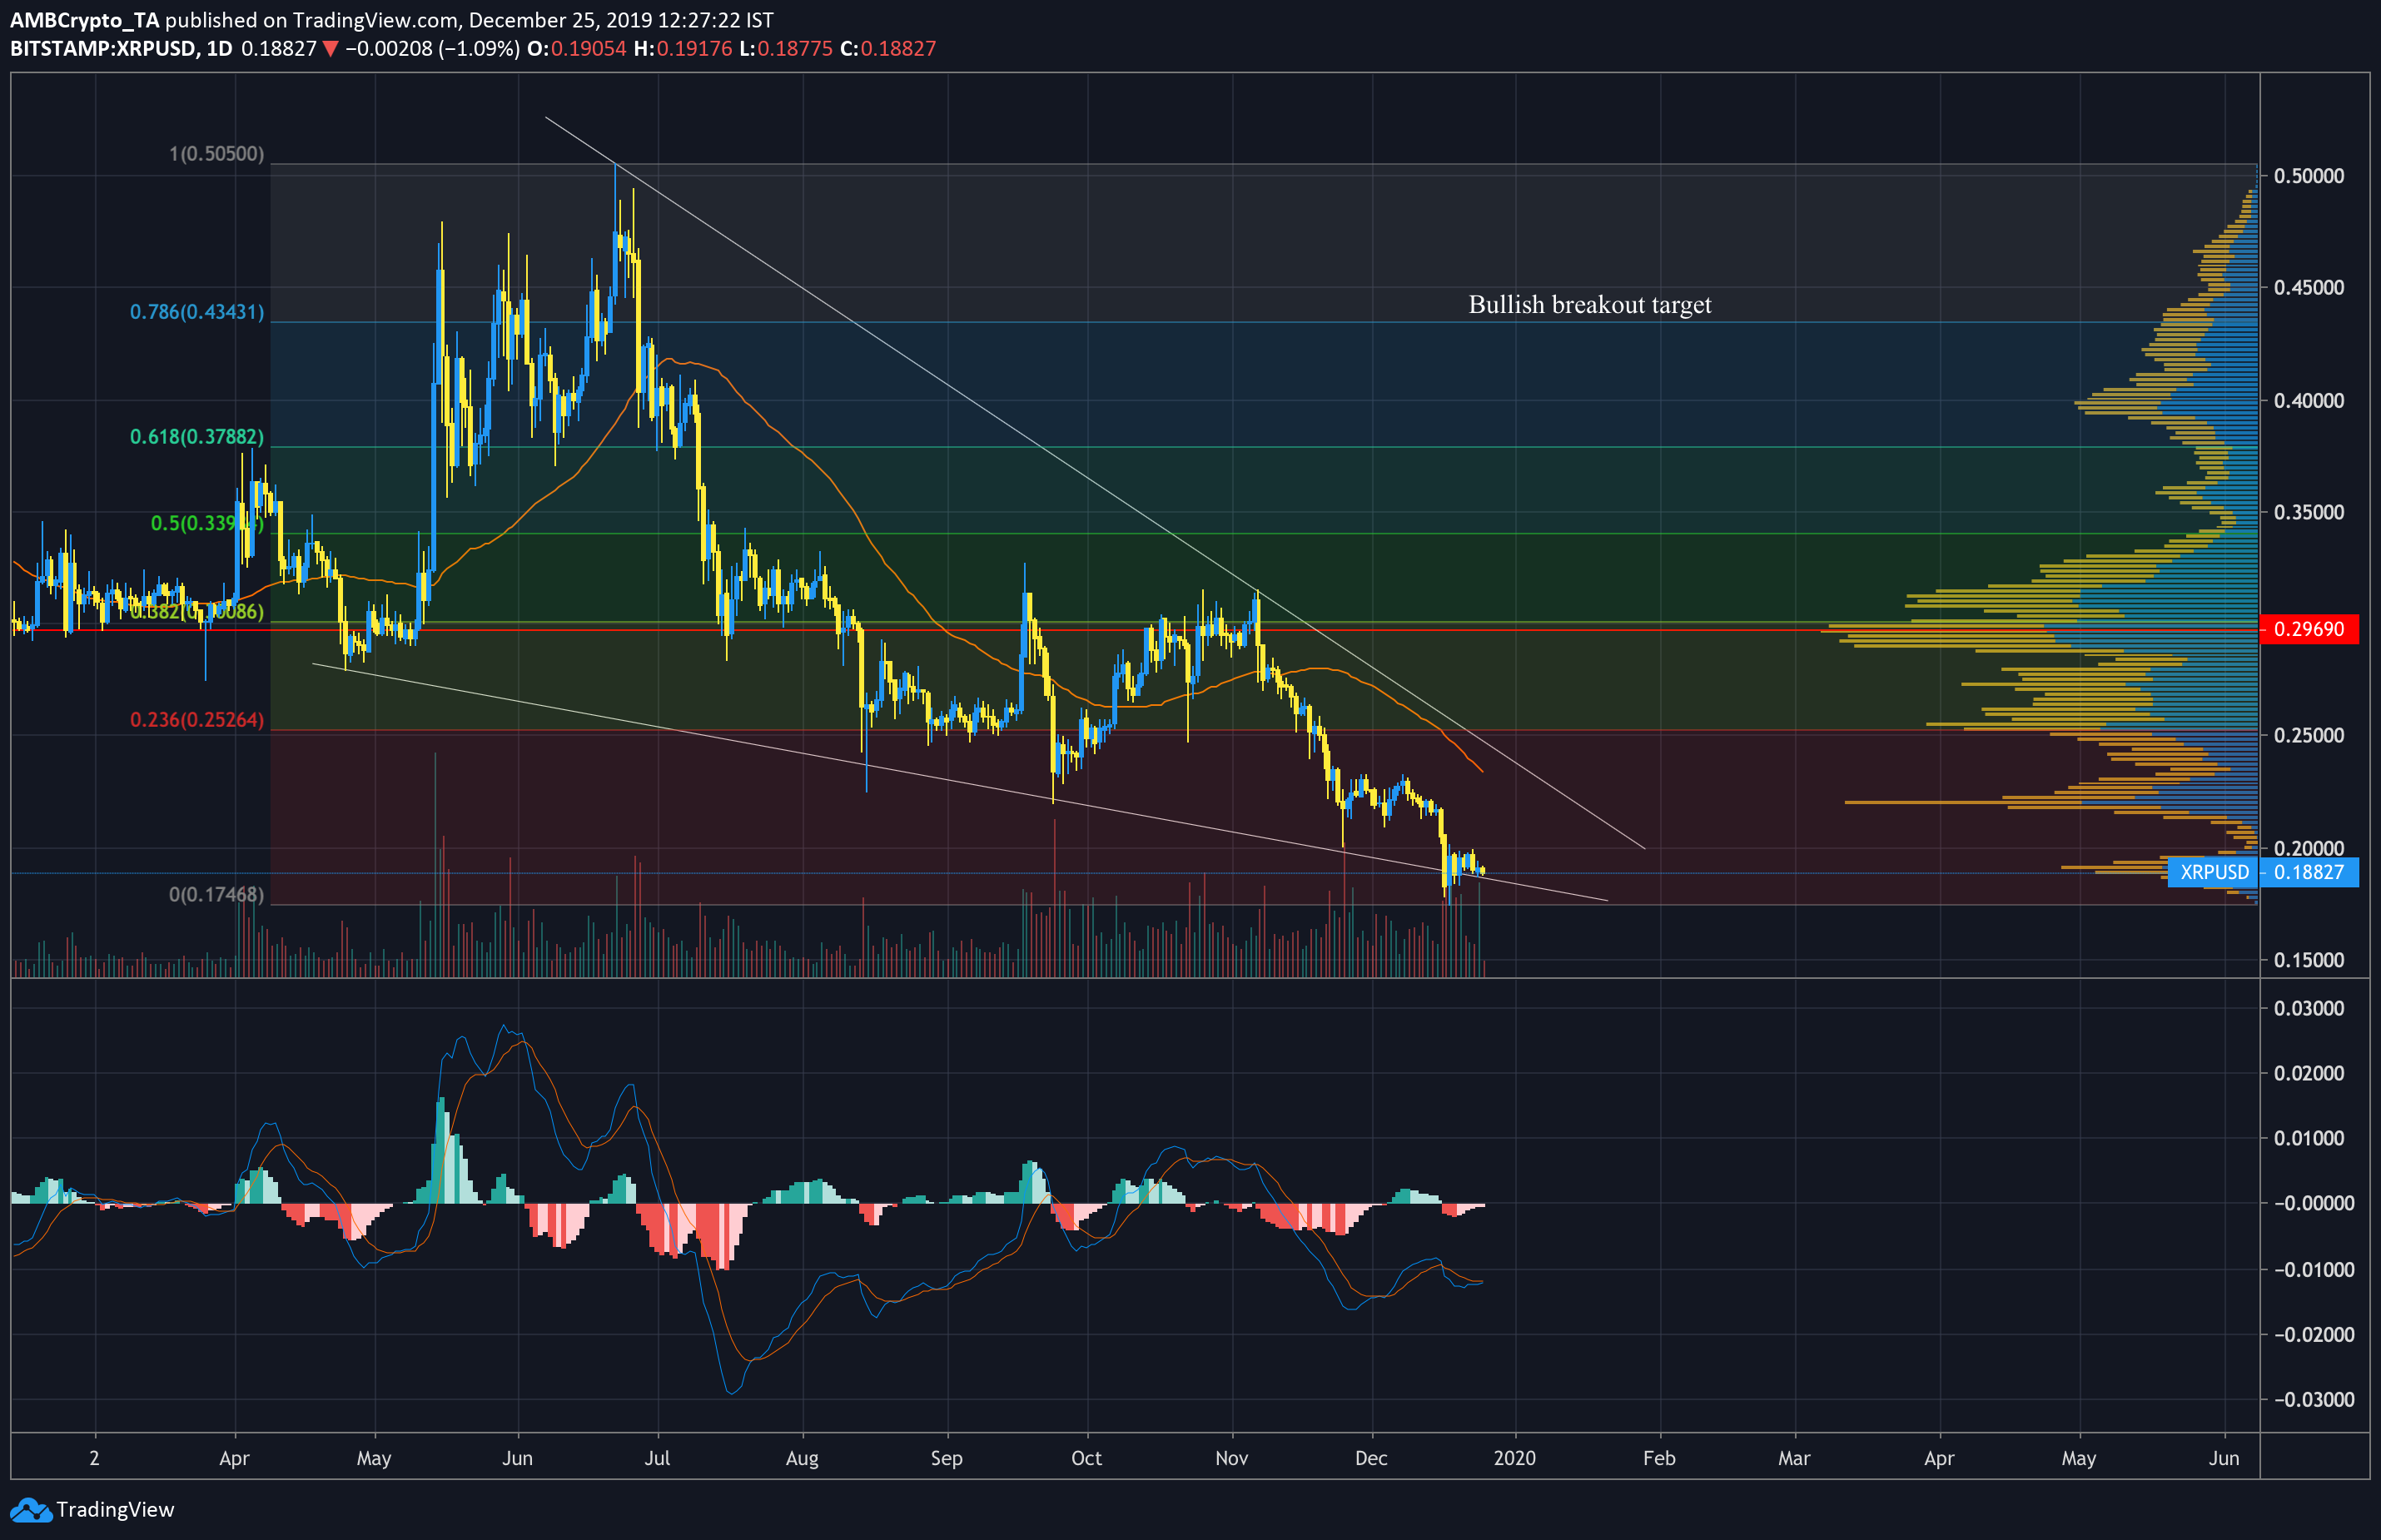
A quick look at the daily chart showed XRP entering a falling wedge pattern toward the end of April, showing sharp swings up to the 2019 highs at $0.50, all the way down to its current lows. The good news is that falling wedges tend to exhibit upward-facing breakouts in nearly 70% of cases. Further, the accompanying volume trend tends to be downward, as can be seen in the above chart, with volume increasing as the price approaches breakout.
Just over a week ago, the daily price candle closed outside the pattern boundary, but the increase in trade volume that followed soon after pushed the price back into the pattern. The 50-day moving average, a reasonably relevant indicator of long-term price, appeared bearish, looming over the price line due to downward pressure on the market in recent times. However, with the MA sloping downward, this could be an opportunity for XRP to cross above it.
Despite low bearish momentum, MACD looked to be in a position to initiate a bullish crossover, with the two lines converging below the -0.01 mark.
XRP, at the time of writing, was moving at the local high volume node on the volume profile, meaning an increase in trade volume could push the price up to $0.218. For volume to increase, market participants need to start buying. With the Fear Greed Index reporting ‘Extreme Fear’, it seems far more likely that XRP may see a drop.
XRP Volatility
Source: CoinMetrics
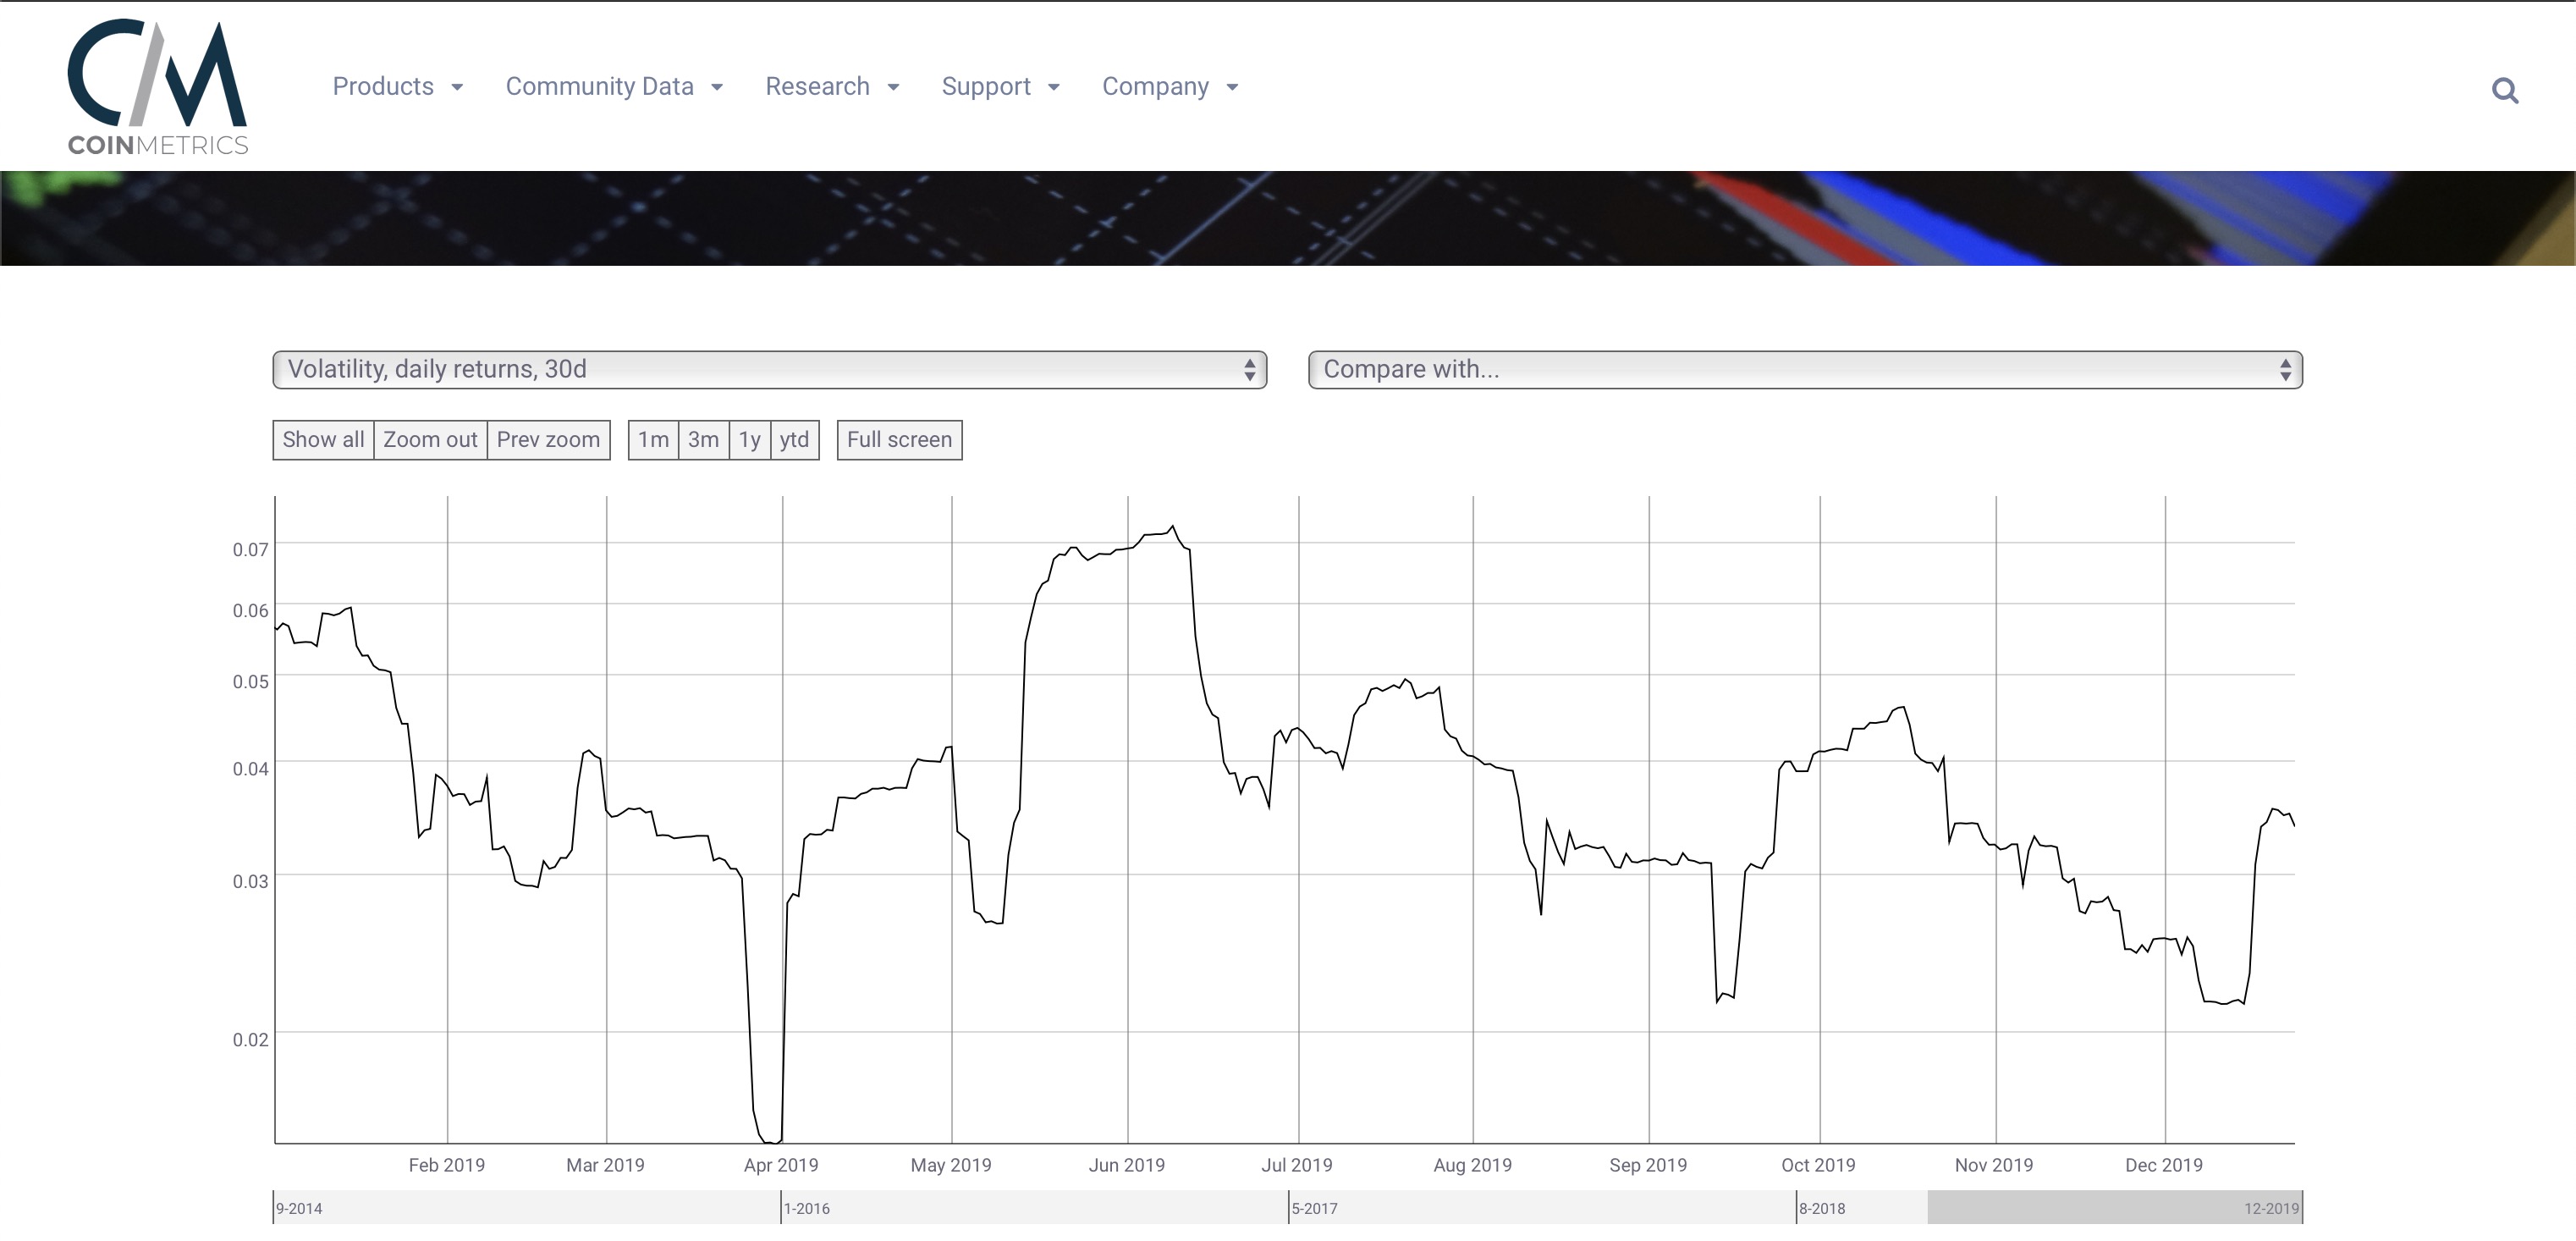
CoinMetrics data on XRP volatility (based on 30d returns) showed a sharp increase in volatility over the last couple of weeks, touching levels seen in mid-October, when XRP last rallied above $0.30. However, this was likely due to the sharp drop in value from around $0.22 to $0.18 just after mid-December. The volatility graph also looks to be dipping, indicating a relative decrease in price swings, and making a spike up in value less likely.
XRP Correlation with Bitcoin
Source: TradingView
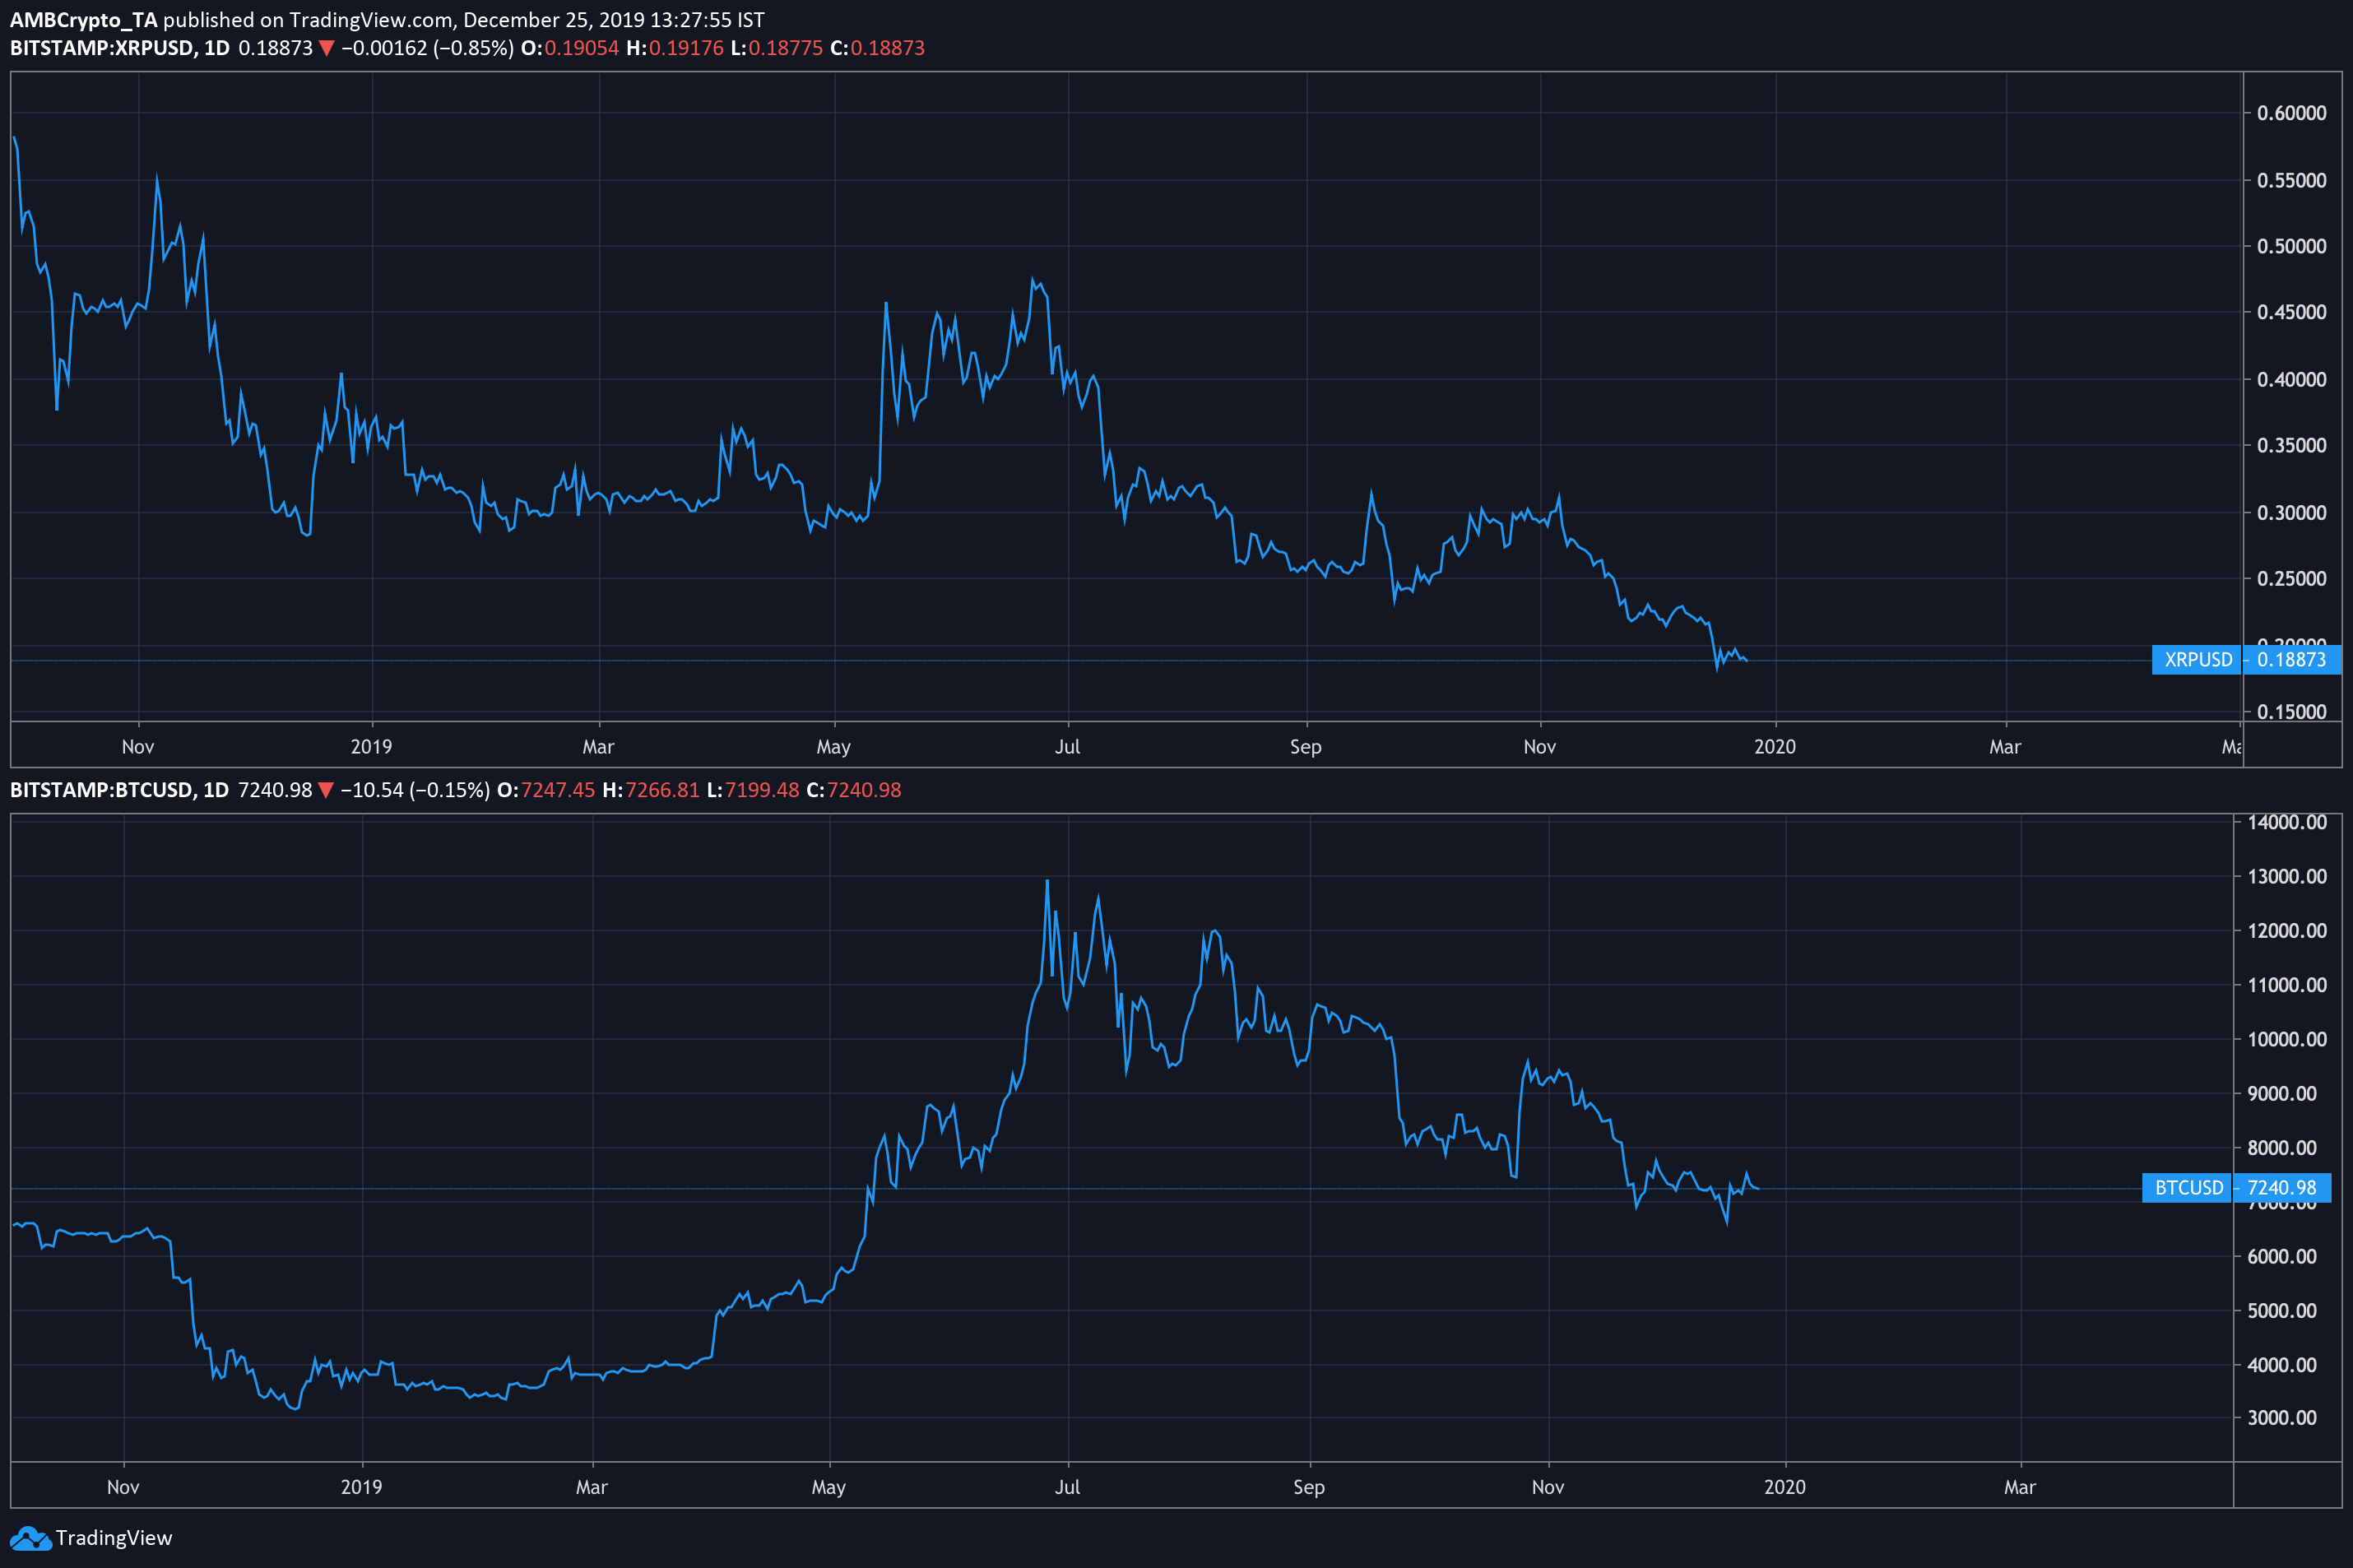
CoinMetrics’ data also showed XRP’s 180-day correlation with Bitcoin has been going through a steady decline since mid-June, around the time XRP touched its 2019 high. Bitcoin’s reaction to the recent dip to $6500 was to nudge its way back up above $7000 and consolidate between $7200 and $7300. The lower 0.65 correlation could mean that XRP is less likely to ramp up to a safer zone.
It’s worth noting that on a 90-day time-frame XRP correlation with Bitcoin is on the same level seen during June and July, indicating a possible correction on a shorter time scale.
Conclusion
A bullish breakout from this pattern could push XRP all the way up to the 78.6% Fibonacci retracement line, above $0.43, however it is likely to face heavy resistance from the dipping 50-day moving average, and the VPVR point of control at $0.29.
Though volatility looks to be dropping, it is still higher now than in the first half of December, and price swings can be in both up and down directions. A downward breakout could drop XRP price down to a staggering $0.10 in January. But though the breakout is approaching, this lowering of volatility will likely cause some sideways movement before a move out from the pattern.
If more investors decide not to buy this dip, XRP could see lows seen in the months following XRP’s inception.
The post appeared first on AMBCrypto


