- BNB is under a bearish threat with a double-top pattern.
- Surrounding fundamentals could keep buyers alive for the next rally.
- Despite bearish signs, BNB remains bullish on a short-term trend.
Following a recent tweet by Changpeng Zhao @CZ_Binance: a new token sale of WazirX (WRX) was announced to take place on the Binance launchpad next month – the first IEO in 2020.
BNB/USD: The Rejection at $18.5 Could Cause Severe Drop For BNB
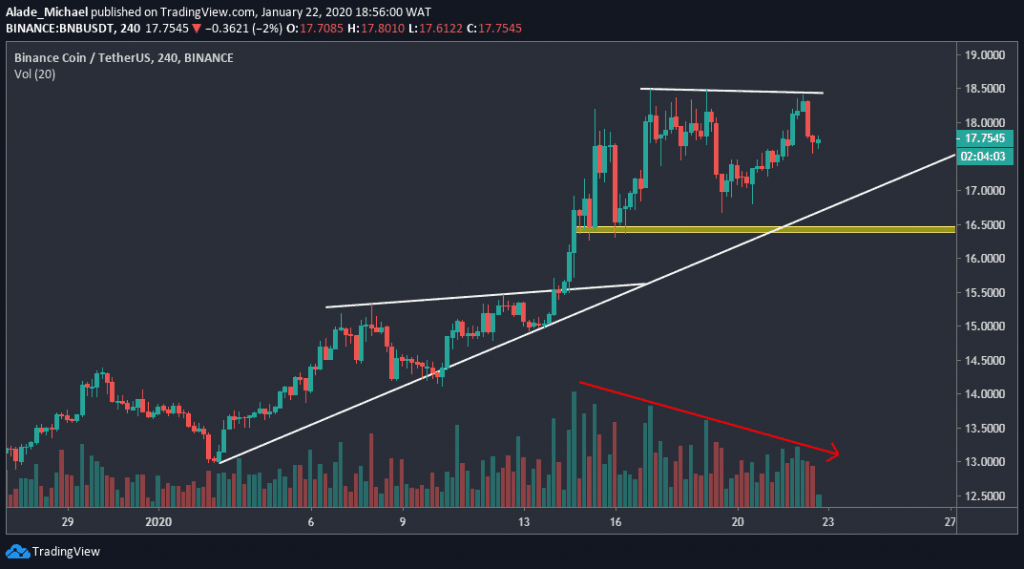
Key Support Levels: $16.4, $15.5
Key Resistance Levels: $18.5, $20
This week, BNB regained momentum after witnessing a sudden correction from $18.5 price level last weekend. While holding a $2.76 billion market cap valuation, the 9th largest cryptocurrency is currently trading around $17.77 levels with approximately $285 million volumes. As of now, BNB is correcting gains of 0.28% over the last 24-hours trading.
Binance Coin Price Analysis

BNB is currently bullish on a short-term outlook. Starting the year 2020 on a positive foot, BNB saw its first significant gains of the year after breaking the two weeks ascending triangle on January 15. This breakout fueled BNB nicely to $18.5 before correcting downward last week.
Today, a double-top pattern was spotted on the 4-hours chart following a retest around the $18.5 resistance level. This bearish sign would become valid if BNB drops beneath the white ascending trend line, forming since earlier this moment.
This bearish scenario could get even worse if the price continues to fall. However, the next line of support to look out for is $15.5. More so, it’s important to pay attention to the price chart’s volume that has been dropping for a while now. In case the bulls manage to push the price above the $18.5 resistance, BNB is expected to hit $20 in the next bullish rally.
BNB/BTC: BNB Awaits Completion Of XABCD Harmonic Pattern For Rebound

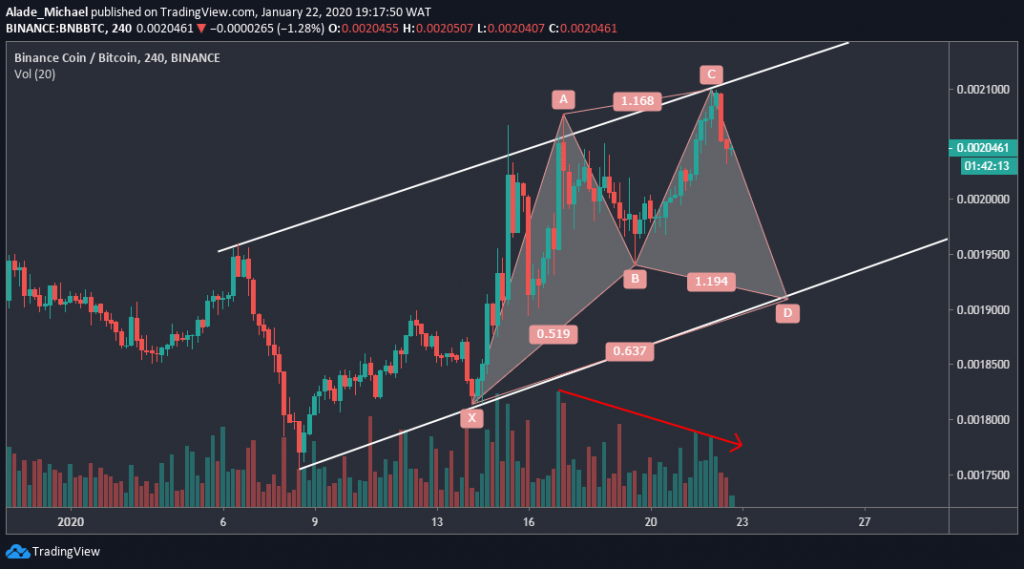
Against Bitcoin, BNB seems to follow the same pattern as with the US Dollar. This correlation has positioned this market in a bullish trend. Though, Binance has been keeping a rising channel pattern for the past three weeks now.
Spotting a XABCD harmonic pattern on the chart, BNB is now footing a bearish retracement to complete a bullish cipher at the channel’s support. Following the sudden price reduction at the channel’s resistance, BNB is hovering around 204570SAT price levels at the time of writing this article. We can expect further losses in a few hours.
BNB Price Analysis
Paying attention to this current bearish signal, BNB is expected to drop into the support of 200000SAT and 195000SAT levels soon. One more thing to consider here is that the volume is currently on the low side. This indicates that price is likely to drop any moment from now.
Meanwhile, there’s hope for the bulls if the channel’s lower boundary can provide support BNB and most especially completing the XABCD harmonic pattern. Providing a bullish cipher pattern, the price would charge at 205000SAT and 210000SAT resistance levels. If this channel’s support could not contain bearish momentum, BNB may break lower.
Disclaimer: Information found on CryptoPotato is those of writers quoted. It does not represent the opinions of CryptoPotato on whether to buy, sell, or hold any investments. You are advised to conduct your own research before making any investment decisions. Use provided information at your own risk. See Disclaimer for more information.
Cryptocurrency charts by TradingView.
Technical analysis tools by Coinigy.
The post appeared first on CryptoPotato


