- Ethereum saw a decline of about 7%, bringing the price for the coin beneath $160.
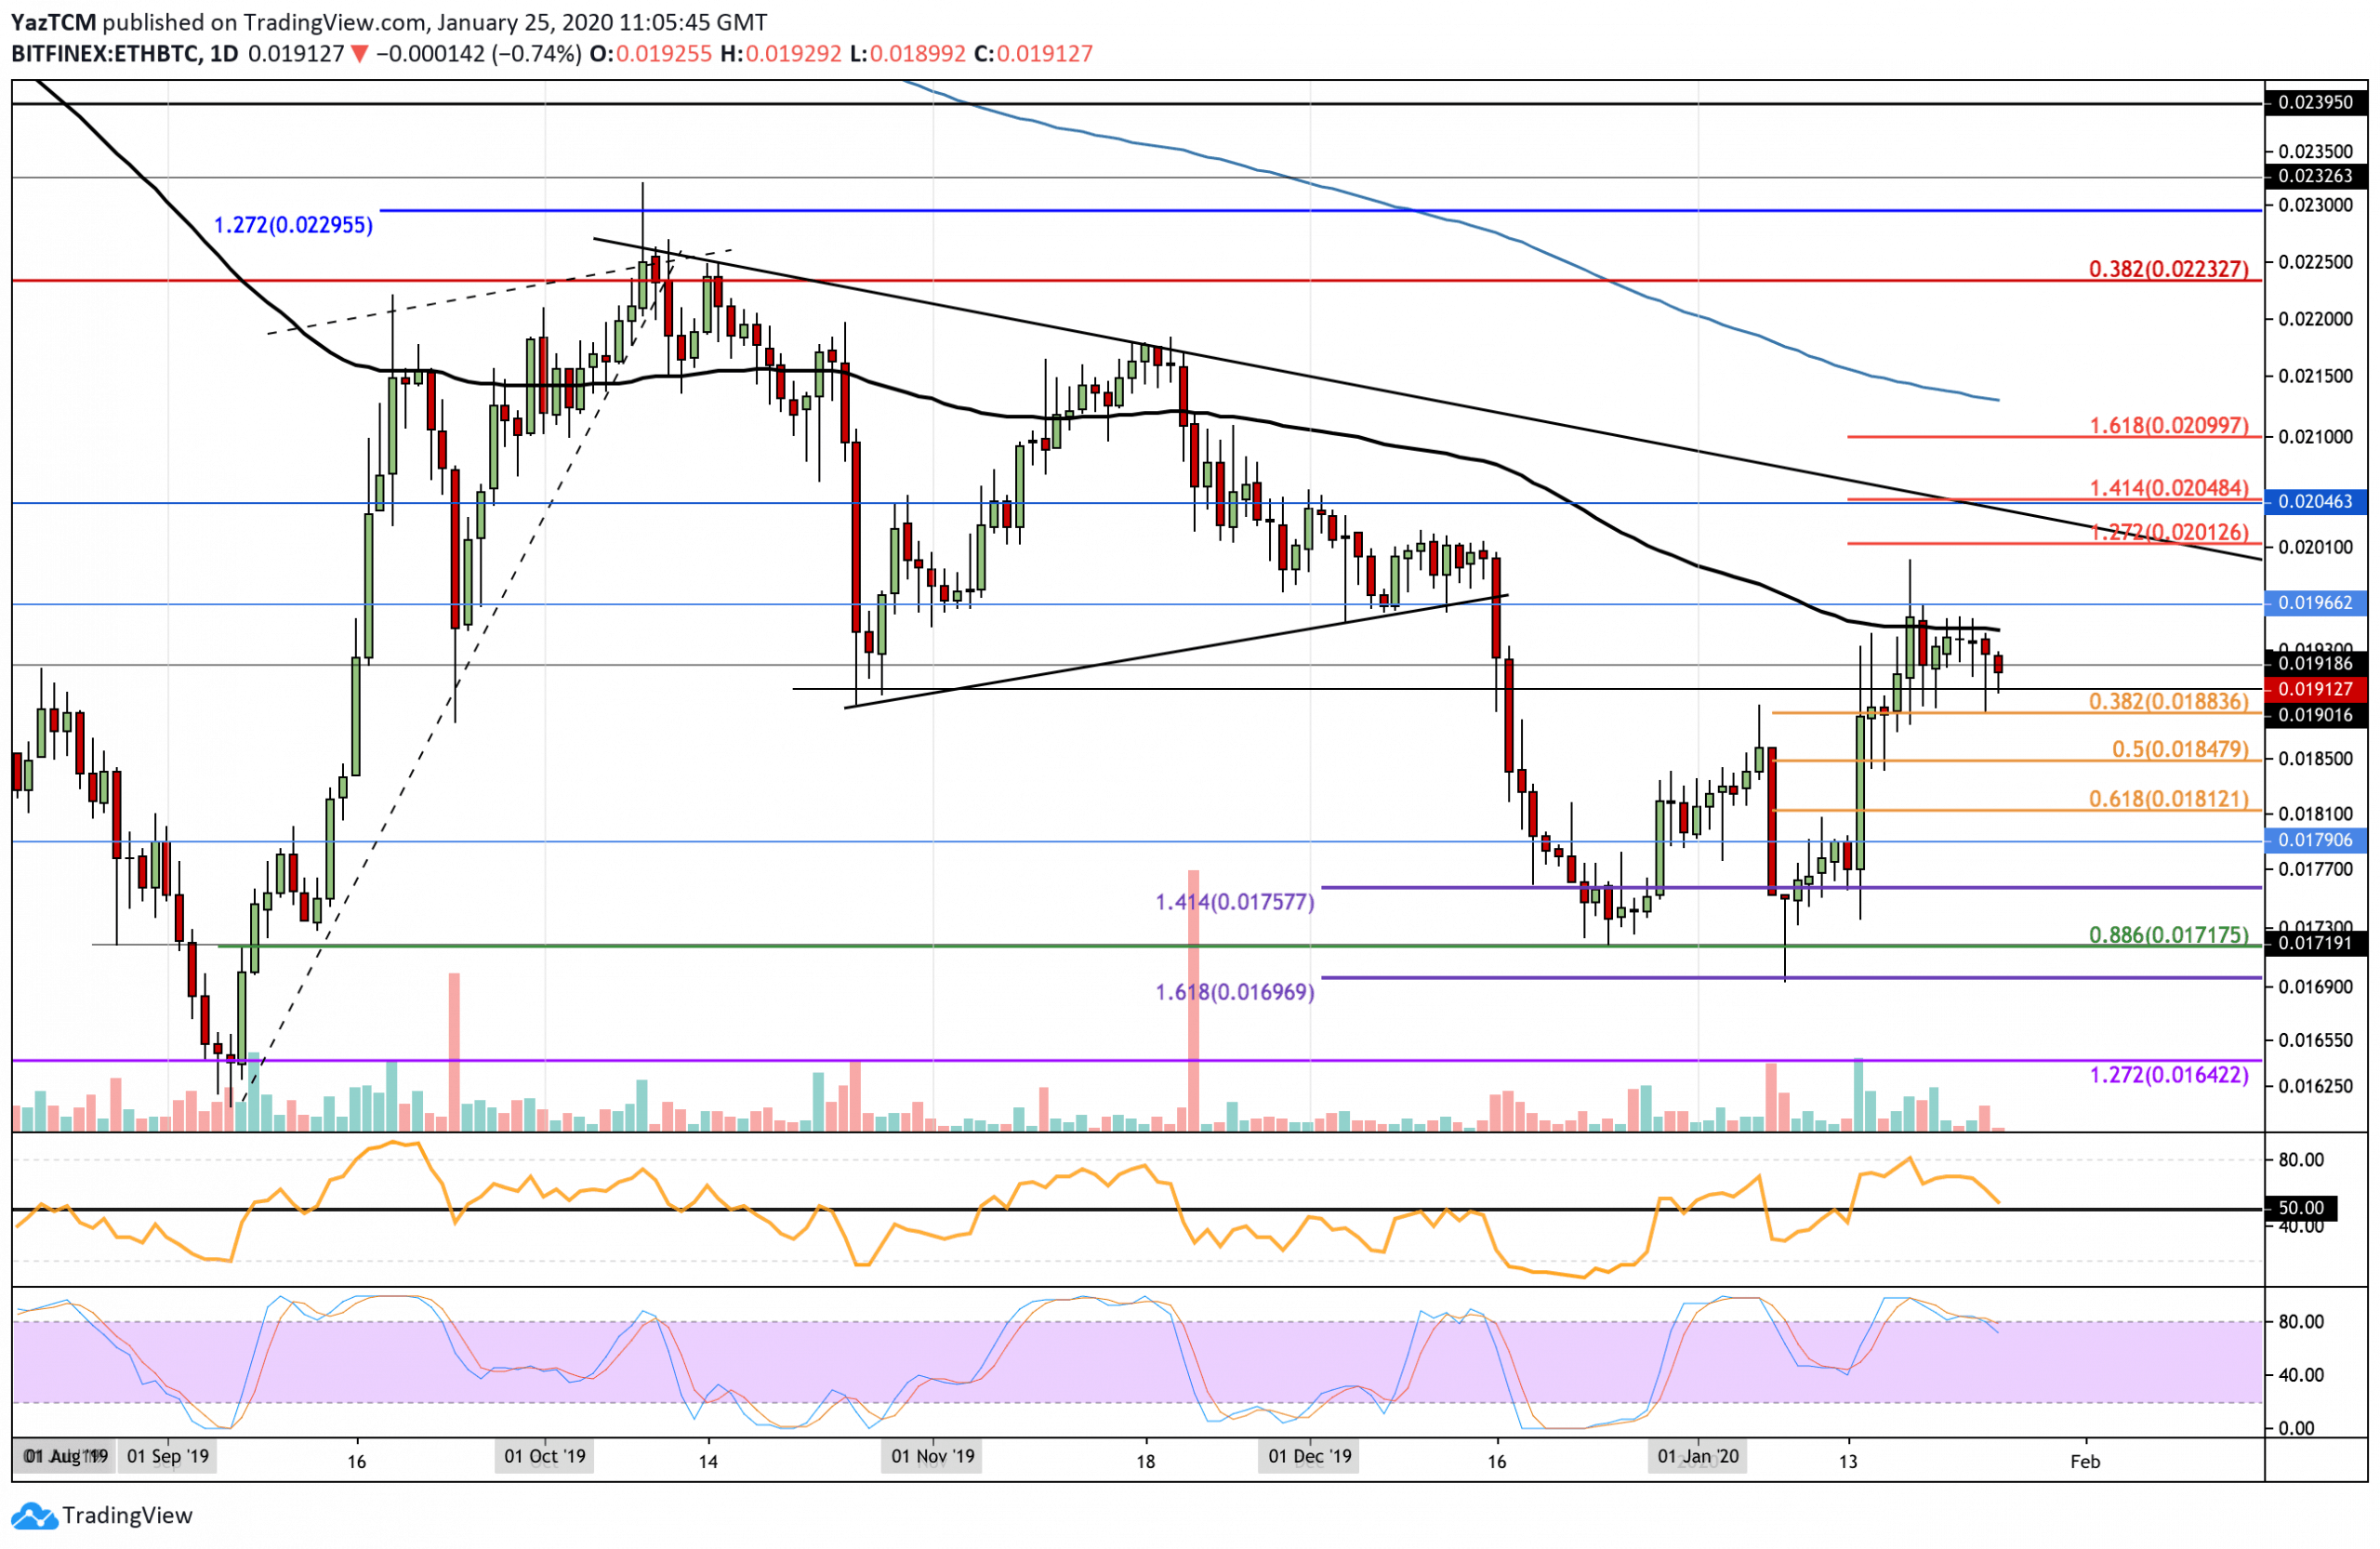
- Against BTC, ETH dropped lower but managed to find support at 0.018 BTC to rebound back above 0.019 BTC.
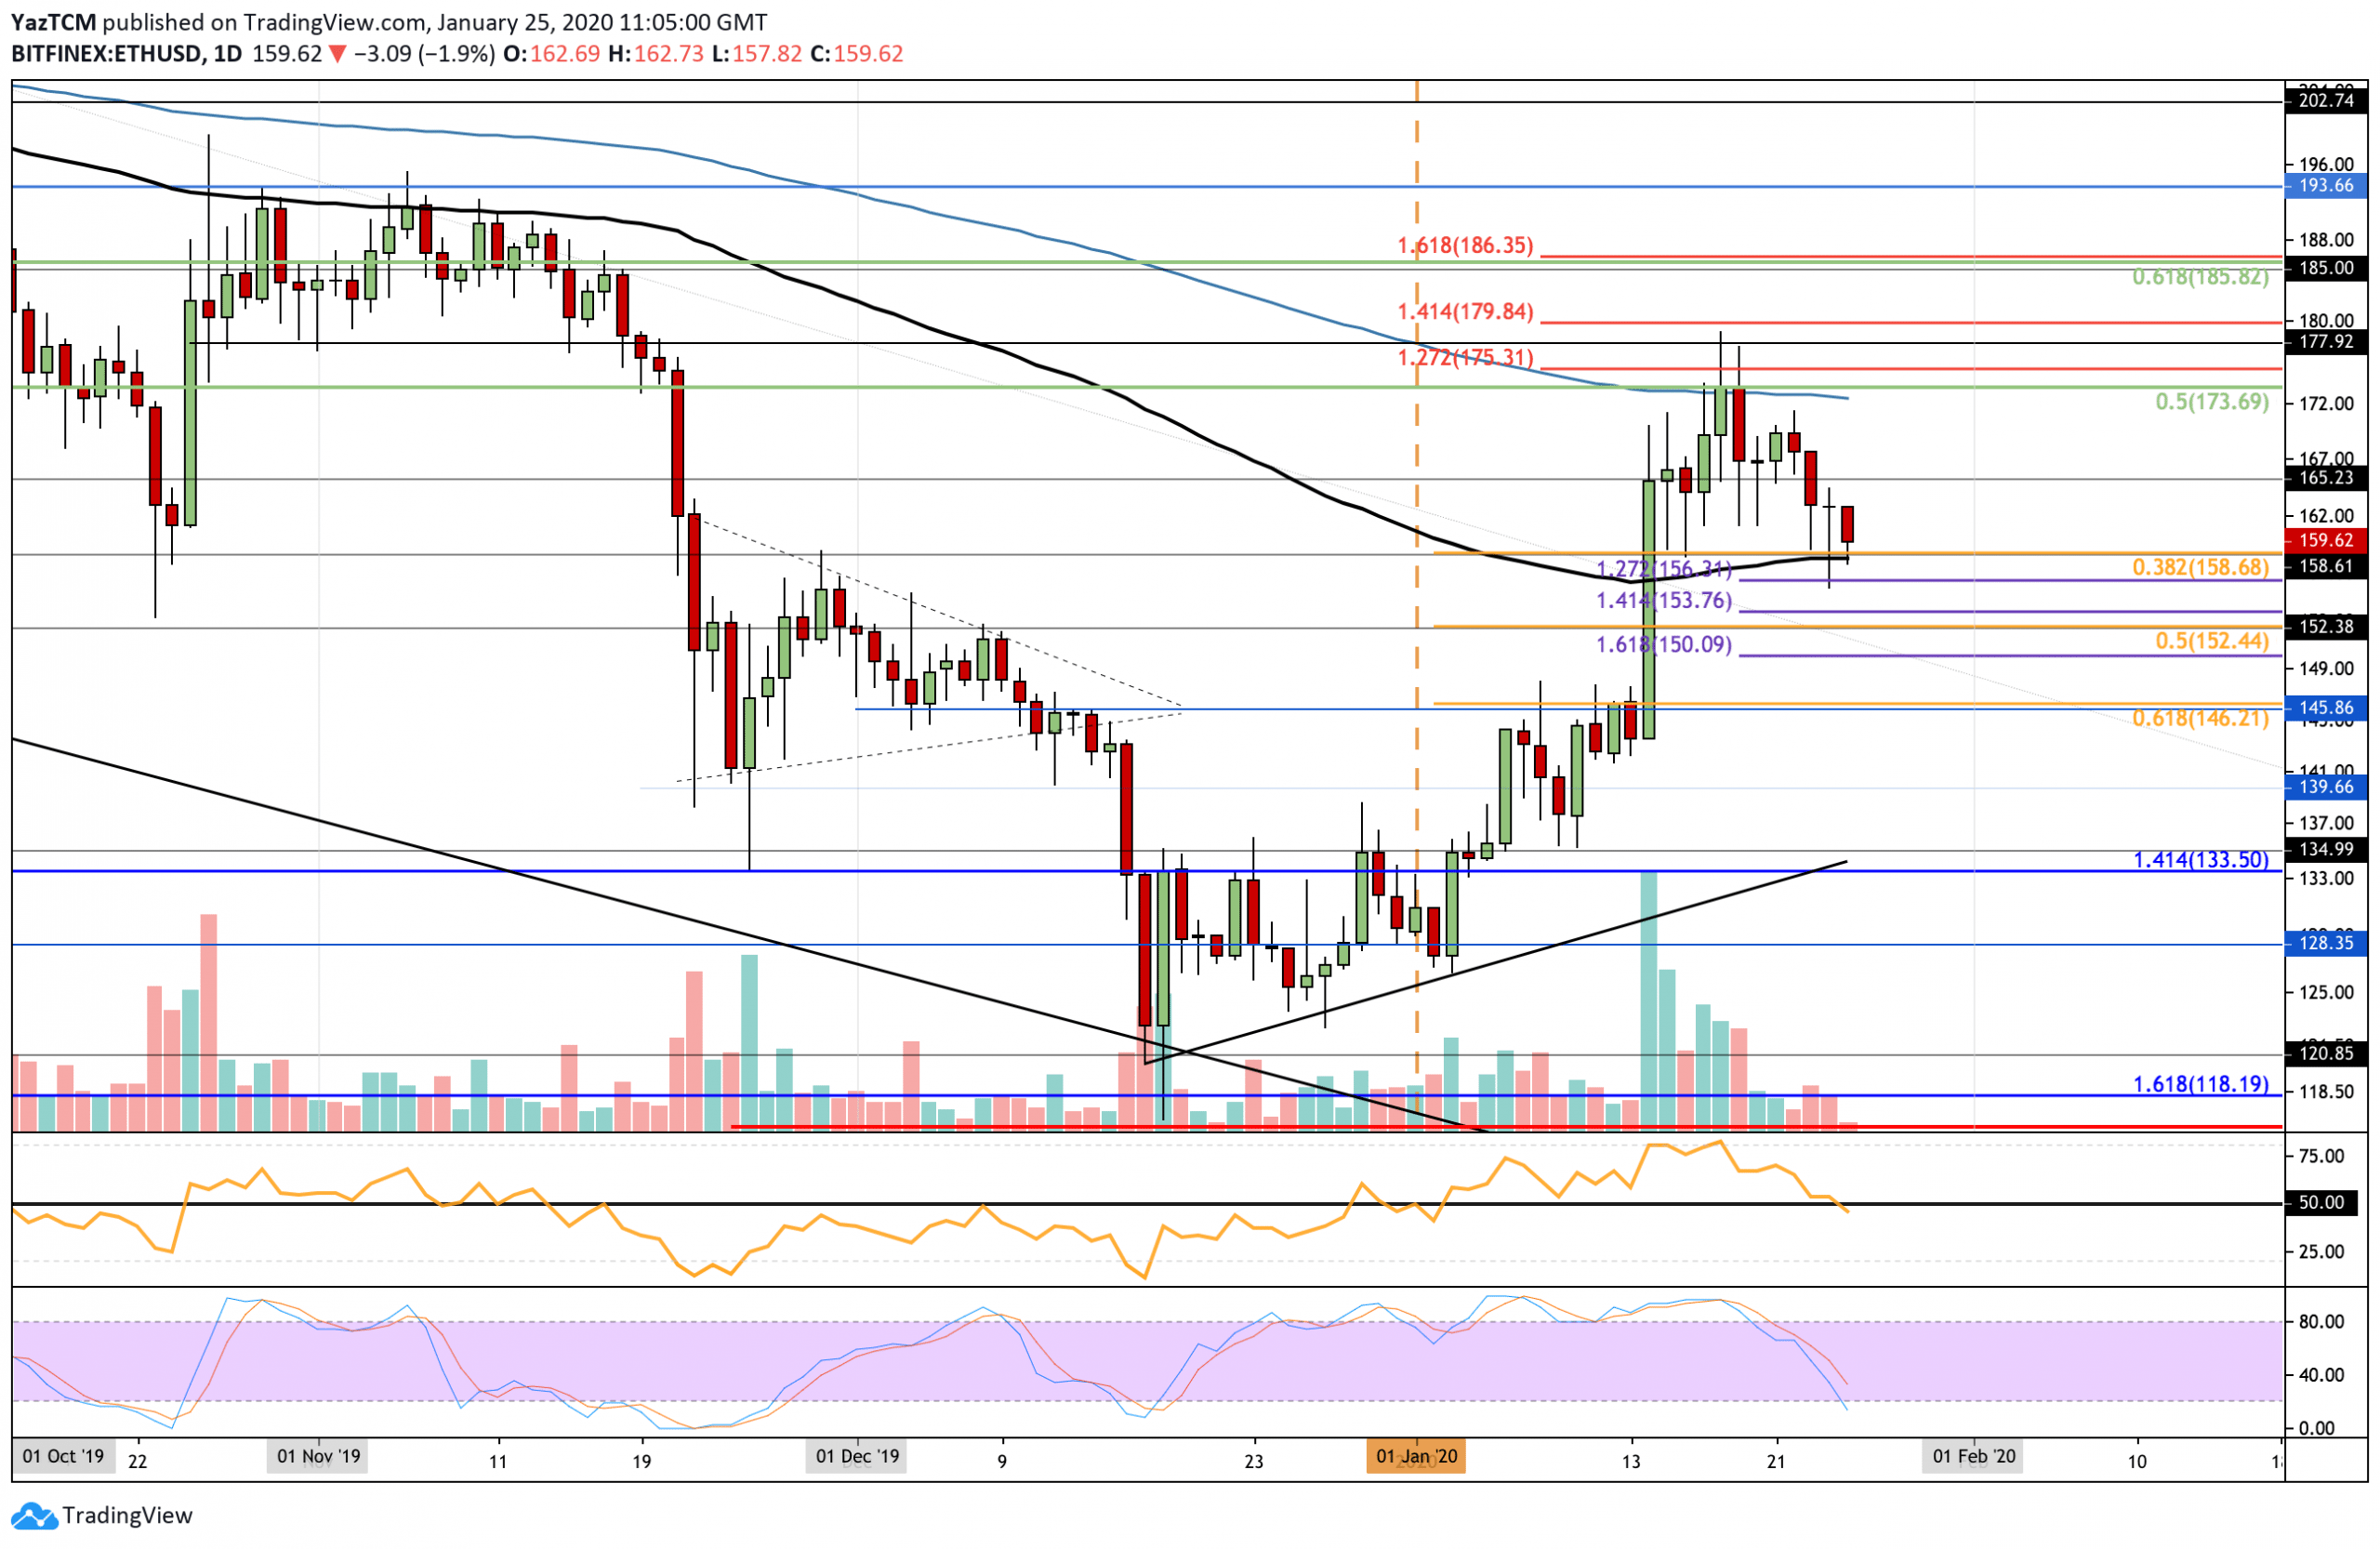
- Ethereum is now testing support at $159 and will likely head toward $146 if it collapses beneath.
Key Support & Resistance Levels
Support: $158, $152, $145, $133.50.
Resistance: $172, $175, $180, $186, $194.
Support: 0.0188 BTC, 0.0185 BTC, 0.0181 BTC, 0.0171 BTC.
Resistance: 0.0195 BTC, 0.020 BTC, 0.0204 BTC.
ETH/USD: ETH Finds Support At 100-days EMA But Will It Hold?

Since our last analysis, ETH continued to trend lower to break beneath $160. It has found support at the 100-days EMA at around $159, which is bolstered by a short term .382 Fibonacci Retracement level. Ethereum briefly slipped beneath the 100-days EMA in yesterday’s trading session, falling as low as $156, but eventually bounced higher.
If ETH were to drop beneath the support at the 100-days EMA, it would be considered to be trading within a neutral trading condition. To turn bullish again, ETH must rise and break above the 200-days EMA. For this market to be considered as bearish, it would need to drop further lower and break beneath $133.50.
Ethereum Short Term Price Prediction
If the selling pressure increases to push ETH beneath $158 and the 100-days EMA, initial support lies at $156 and $153. Beneath this, additional support is located at $152.44 (.5 Fibonacci Retracement level) and $150 (downside 1.618 Fibonacci Retracement level). Alternatively, if the bulls can defend the support at the 100-days EMA and rebound higher, the first level of strong resistance lies at $165. Above this, resistance lies at $172-$174 (200-days EMA & bearish .5 Fib Retracement), $177, and $180.
The RSI penetrated beneath the 50 level, which is a worrying signal for the bulls as the sellers start to take control over the market momentum. If the RSI does not rebound before today’s session closes, we can expect ETH to be heading beneath the 100-days EMA. The Stochastic RSI is showing some promise for the buyers as it approaches oversold conditions. A bullish crossover on the Stochastic RSI could indicate that the sellers have finished the latest round of selling.
ETH/BTC – ETH Headed Toward Short Term .382 Fib Support – Can It Hold?

Against Bitcoin, ETH continued to trend lower from the 100-days EMA resistance. In yesterday’s trading session, it found support at 0.0188 BTC (.382 Fibonacci Retracement level), which allowed it to bounce back above 0.019 BTC. However, it does seem that the market is likely to retest this level of support pretty soon.
ETH remains in a neutral trading condition until the support at 0.0185 BTC is broken, at which point the market would then be considered as bearish. To turn bullish, Ethereum would need to climb above 0.0204 BTC to create a fresh high above the December 2019 highs.
Ethereum Short Term Price Prediction
If the bears continue to push the market lower, the first level of strong support is located at 0.0188 BTC (short term .382 Fib Retracement). Beneath this, additional support can be found at 0.0181 BTC (.618 Fib Retracement), 0.0179 BTC, and 0.0175 BTC. On the other hand, if the bulls defend the support at 0.0188 BTC and push higher, resistance is expected at 0.0195 BTC (100-days EMA). Above this, resistance lies at 0.02 BTC and 0.0204 BTC.
The RSI continues to fall from overbought conditions, which suggests that the buying pressure is fading. Nevertheless, it is still yet to break beneath the 50 level, which could give some potential hope for a recovery. The Stochastic RSI has recently produced a bearish crossover signal, which should send the market lower.
Disclaimer: Information found on CryptoPotato is those of writers quoted. It does not represent the opinions of CryptoPotato on whether to buy, sell, or hold any investments. You are advised to conduct your own research before making any investment decisions. Use provided information at your own risk. See Disclaimer for more information.
Cryptocurrency charts by TradingView.
Technical analysis tools by Coinigy.
The post appeared first on CryptoPotato


