- LINK is trading at a crucial resistance area after seeing gains of 13%.
- Chainlink is technically bullish across trading pairs but still facing a tough level at the immediate resistance.
- A pullback is likely if Link fails to overcome the current trading level.
LINK/USD: Link Could Be Ready For Huge Rally But Still Waiting For Confirmation Above $4
Key Resistance Levels: $4, $4.55, $5
Key Support Levels: $3.5, $3.3, $3.1

LINK/USD. Source: TradingView
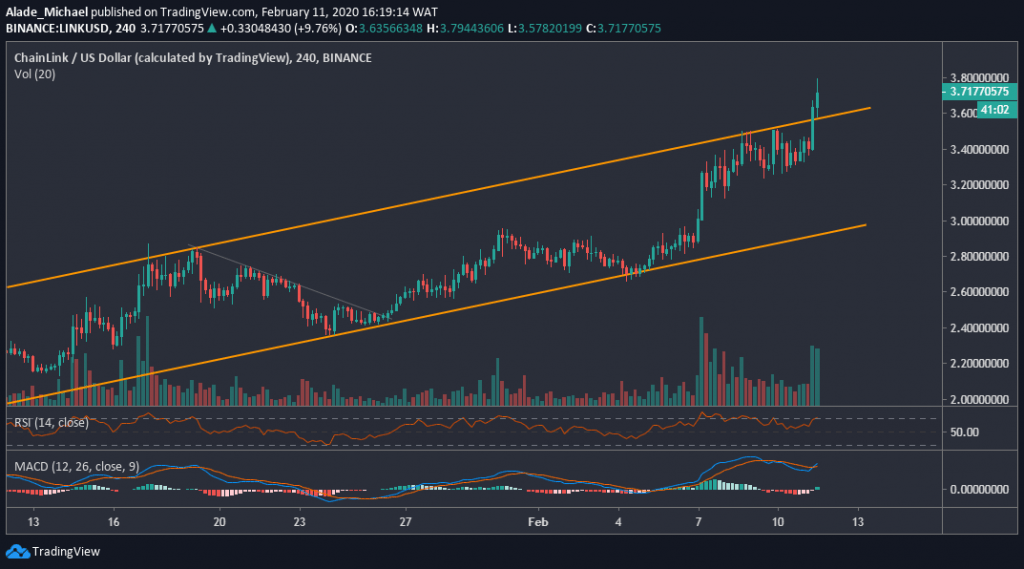
Since our previous analysis, Chainlink has seen sizeable volatility to the upside. This notable price movement has made the price of Link hit the key resistance level of $3.75 level that was mentioned in the last analysis. Though, Link has managed to reach $3.8 today.
With 9.66% growth over the past few hours, Link is currently trading around $3.8. The last 24-hours surge has brought Link out of the channel pattern that trapped bullish actions over the past weeks. Now that the bulls have shown interest again in this market, Chainlink is expected to see a massive gain in the coming days.
Chainlink Price Analysis
The recent price break has given buyers more advantage over the bears on the 4-hours. As we can see, Link was trading in a rising channel for weeks after witnessing a significant surge a few hours back. Now, the next key buying level to keep in mind is $4 resistance. The resistance above this level lies at $4.55 resistance and perhaps $5 on a near-term bullish. That is likely if Chainlink can reclaim the $3.8
On the other hand, it’s important to watch out for a potential drop, which might result in a fake-out. If Link’s price drops and rolls below $3.5, around the channel resistance-now-support, we may need to watch out for the immediate support of $3.3 inside the channel. A steep roll could bring us further to $3.1, where the channel’s support is aligned.
Link’s volume is just becoming significant on the 4-hours chart to indicate more gains ahead for the bulls. More so, we can see that the technical RSI and MACD indicators are currently bullish. We can expect a drop once these indicators turn bearish. But as it appeared now, Link is preparing for another bullish rally against the US Dollar. An intense buying should be expected!
LINK/BTC: Link Facing Tough Resistance Around 0.000372SAT Level, Will Buyers Overcome?

LINK/BTC. Source: TradingView
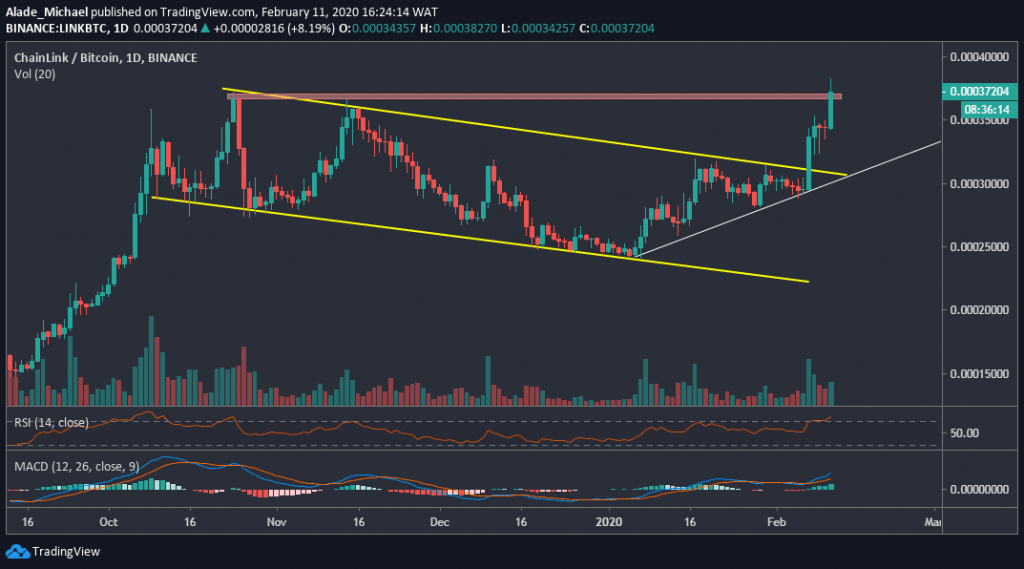
Against Bitcoin, Chainlink has continued to follow a bullish sentiment since the February 7 bullish flag breakout on the daily chart. Furthermore, the 0.000372 resistance level we mentioned in our previous price analysis was smashed today, following a considerable price movement to 0.00038SAT level.
Link is expected to keep rising as long as volumes flow into the market. A weak volume could cause volatility to decrease. Nonetheless, the bulls are still showing a lot of commitment at the moment.
Chainlink Price Analysis
The February 7 bullish flag breakout was entirely instrumental to the ongoing price surge in the LINK/BTC pair. However, the bullish sentiment started since the beginning of the year 2020 when Chainlink was priced as low as 0.000245SAT level, now trading at around 0.000372SAT level.
Touching 0.00038SAT level on the day, Link may see more gains if the bulls can further show commitment in the future. While anticipating the next bullish rally, we may consider the 0.00045SAT level as the next short-term resistance. However, the 0.00040SAT level is quite closer enough for the bulls.
Meanwhile, the current trading level of 0.00037SAT is a crucial resistance area. If Link’s price rejects at this level, we may need to consider near support for a rebound. This support is located right on the white rising trend line. Close support here is 0.00035SAT level. A notable drop below this white line could trigger bearishness in this trade.
Looking at the daily technical indicators, Link is showing strong bullish momentum, though we may need to watch out for a possible drop in case the RSI and the MACD nosedive. For now, Link remains under a bullish radar on the daily chart.
Disclaimer: Information found on CryptoPotato is those of writers quoted. It does not represent the opinions of CryptoPotato on whether to buy, sell, or hold any investments. You are advised to conduct your own research before making any investment decisions. Use provided information at your own risk. See Disclaimer for more information.
The post appeared first on CryptoPotato


