- Following the latest price actions, Ethereum is undergoing consolidation around $135 against the US Dollar
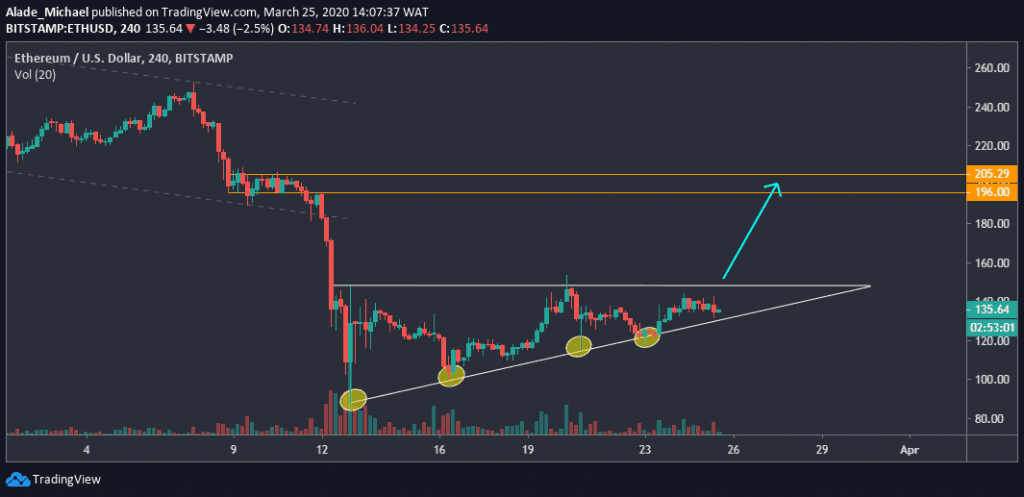
- Ethereum is primed for a massive gain, but the price is still captured in an ascending triangle pattern
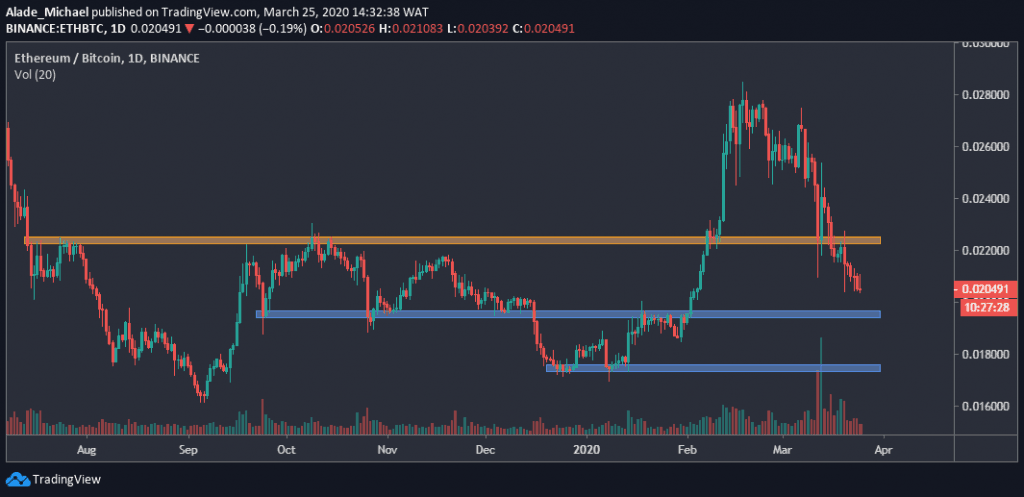
- After breaking long-term support, Ethereum continued to drop and now faces another five-month support at 0.0195 BTC level against Bitcoin.
ETH/USD: Ethereum Looking For Breakout
Key Resistance Levels: $160, $180, $196
Key Support Levels: $121, $101, $86

This week, the cryptocurrency market continued to recover due to the increase in Bitcoin’s price and volumes, which have cumulatively brought the total market capitalization to $187.5 billion at the time of writing.
As a result, Ethereum, the second-largest cryptocurrency, has similarly seen substantial growth over the past days after rising from $86 – the monthly low.
Ether has further pushed a series of higher lows at $101, which was last week’s low and $121 (the weekly low). Along with these lows, circled yellow on the 4-hours time frame, Ethereum’s current high is leveled at $149, which technically forms an ascending triangle pattern.
Currently, the price has reached the apex of the triangle formation, which could suggest a potential breakout is underway.
Ethereum Price Analysis
Once a triangle breakup occurs, the significant price gains would be projected at the orange levels of $196 – $205, where Ether consolidated in early March.
Meanwhile, Ethereum is likely to encounter resistance at $153 (last week’s high), followed by $160 and $180 along the way.
On the other hand, if Ethereum turns bearish, a triangle breakdown may cause a serious drop to the previous support of $121. The next support after this is $101 and $86. A drive beneath this support could trigger a mid-term bearish continuation for Ethereum.
ETH/BTC: Ethereum Approaching 5-Month Support
Key Resistance Levels: 0.0225 BTC, 0.024 BTC
Key Support Levels: 0.0195 BTC, 0.0175 BTC

Against Bitcoin, Ethereum is still showing signs of weakness after losing almost 33% of its value in five weeks.
Following these drops, ETH broke beneath crucial support of 0.0225 BTC level on March 13 with further losses to where it’s currently priced at 0.020 BTC.
We can see that Ethereum’s volatility is quite low at the moment. It can be traced to the decreasing volume in the market.
However, as long as the price stays under the orange area of 0.022 BTC, Ethereum would remain in a downward spiral until buyers show strong interest. For now, the bearish trajectory is still valid on the daily chart.
Ethereum Price Analysis
Ethereum is currently approaching five-month support at 0.0195 BTC, which is the immediate blue demand area on the daily chart.
If ETH fails to rebound here, the price may collapse seriously to the second blue demand area of 0.0175 BTC – the December 2019 low.
But looking at the current price actions, it appeared that bears are reaching exhaustion point. If Ethereum can find nearby support and rebound back above the 0.0225 BTC resistance level, there’s hope for the bulls to reclaim the lost 0.028 BTC resistance. Notwithstanding, the 0.024 BTC level remains a close resistance for the buyers.
The post Ethereum Price Analysis: ETH Plotting A Move At $135 But Triangle Pattern Still Holds, What’s Next? appeared first on CryptoPotato.
The post appeared first on CryptoPotato


