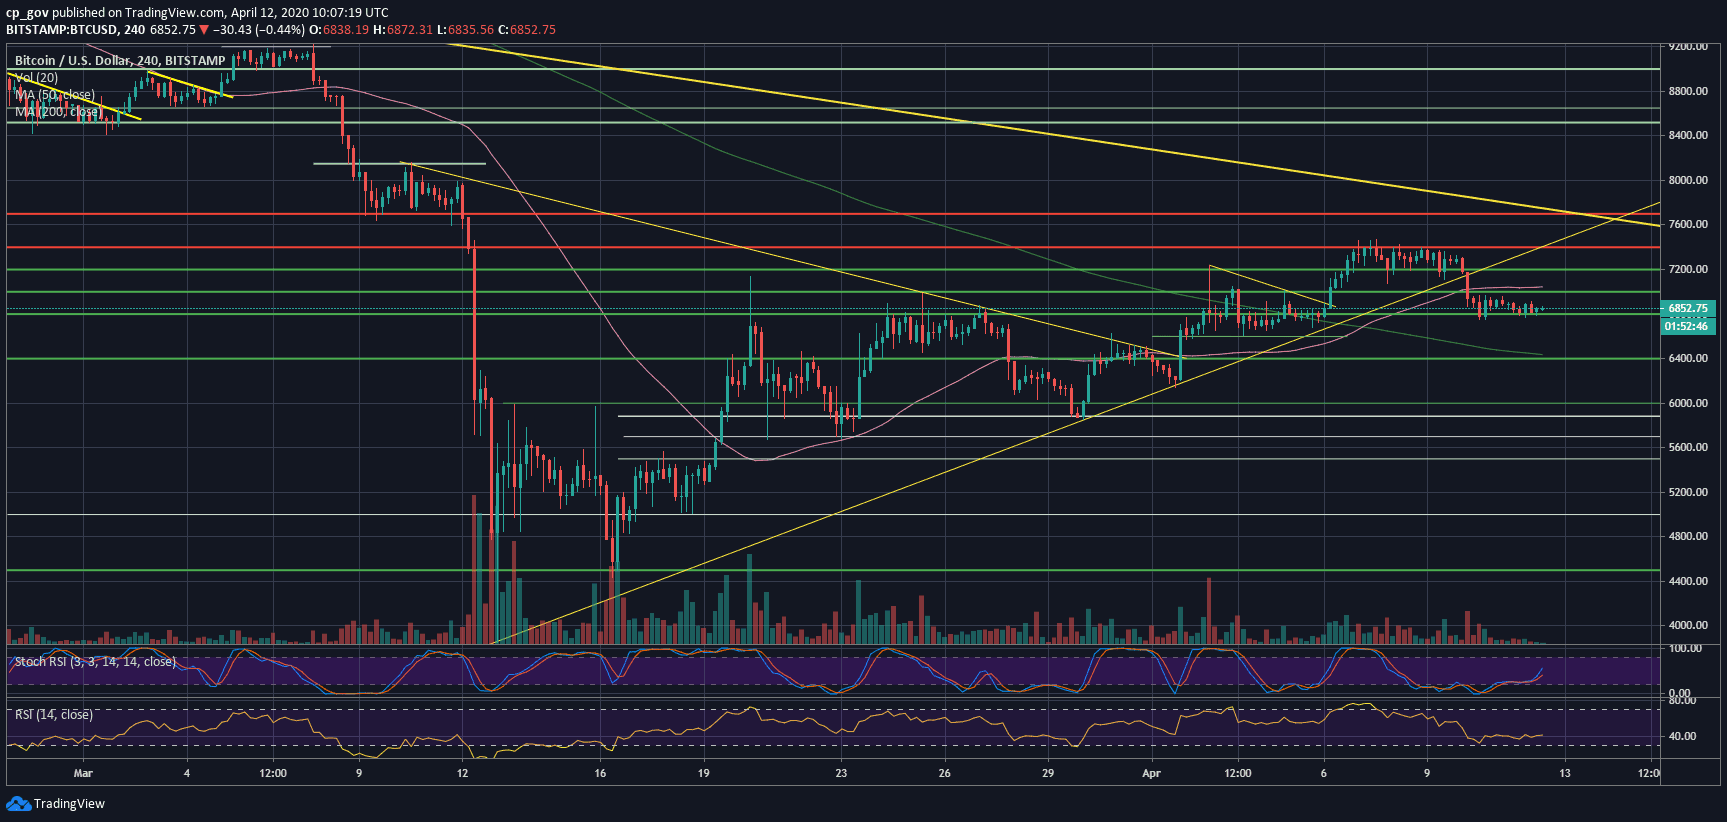
On our most recent BTC price analysis, following Friday’s plunge to the $6800 area, we mentioned that Bitcoin reached a decision point.
Both the price encountered a substantial support area, together with the daily RSI indicator, which reached precisely the 50 level, which is said to be the distinction between a bear and a bull market, or in other words – a neutral market.
Since Friday, Bitcoin was trading inside the tight range of $6800 – $6950 (despite a small glitch to $6750). It’s not a coincidence that we see no major move on behalf of the primary cryptocurrency since Friday.
Wall Street was not trading on Friday (due to Good Friday holiday). Following the recent correlation between Bitcoin and the equity markets, it seems like Bitcoin is patiently waiting for the indices’ futures to open up Sunday’s evening US timezone.
Overall, this is a do or die decision point for Bitcoin’s short-term. From the bullish side, the $6800 was the prior high, and the bullish higher lows trajectory, which started March 12, hadn’t been broken yet.
From the bearish side, the current price zone is very fragile, keeping in mind the RSI indicator (stuck at the 50 mark), along with the Stochastic RSI oscillator, which had made a cross-over pointing down at the overbought territory.
Total Market Cap: $196.1 billion
Bitcoin Market Cap: $125.7 billion
BTC Dominance Index: 64.1%
*Data by CoinGecko
Key Levels To Watch & Next Possible Targets
– Support/Resistance levels: As mentioned above, Bitcoin is facing $6950 from above, as the initial resistance level. Further above lies the support turned resistance area of $7200, which includes the critical 50-days moving average line (marked pink). In case of a break-up, Bitcoin will be facing the monthly high at $7400 – $7500, which was reached last week.
From below, in case the support at $6750 – $6800 breaks down, we can expect a quick move to prior resistance turned support level of $6600 and then $6400. A critical further support area is then located at the $6000 – $6200 range.
– The RSI Indicator: discussed above.
– Trading volume: As mentioned above, with no significant price moves, the volume of the current weekend is minimal.
BTC/USD BitStamp 4-Hour Chart
BTC/USD BitStamp 1-Day Chart
The post Bitcoin Price Analysis: Crucial Support Holds (For Now), But Is a Huge Move Approaching By The Start Of The New Week? appeared first on CryptoPotato.
The post appeared first on CryptoPotato


