- Ethereum increased by 4% over the past 24 hours as it now trades at $233.
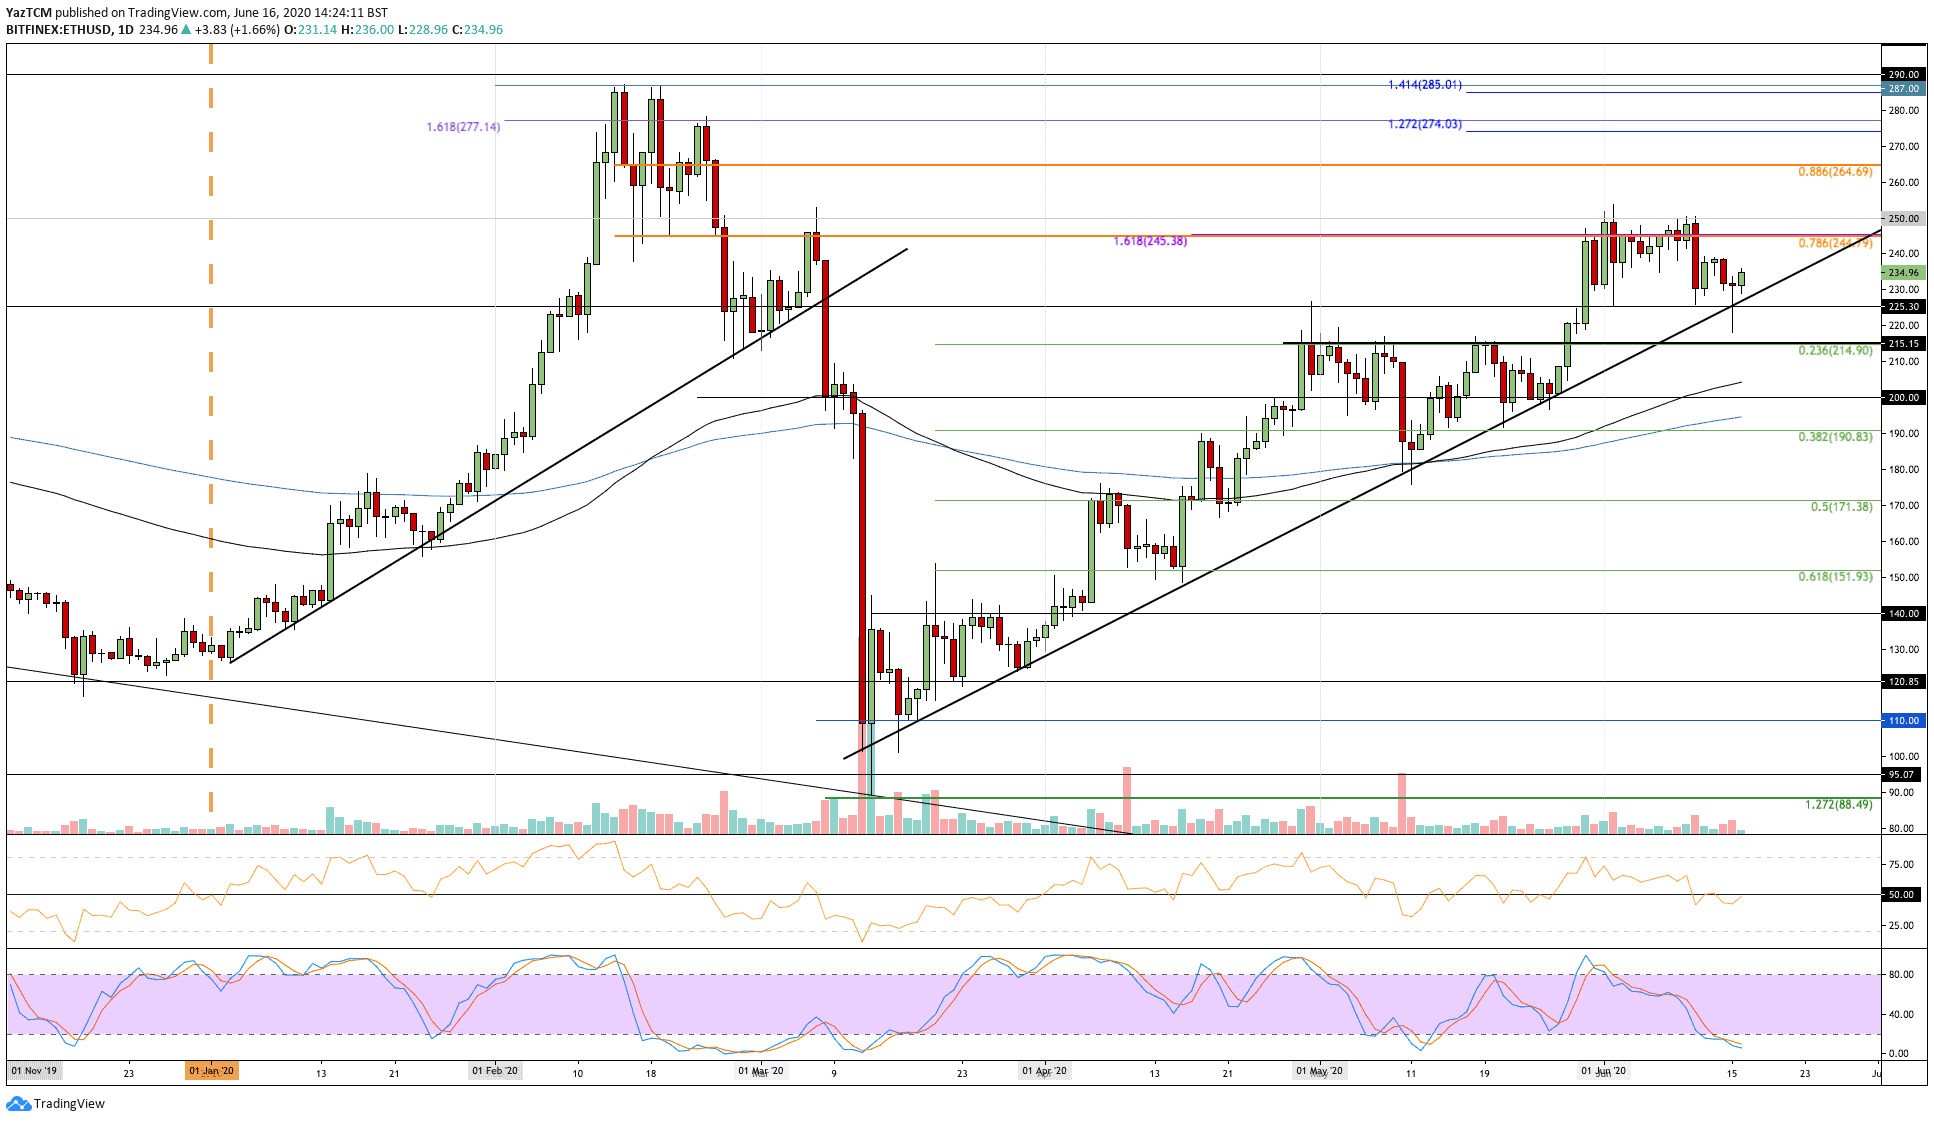
- The cryptocurrency spiked lower yesterday as it broke beneath a rising trend line, but the buyers quickly regrouped to push ETH above it before the close.
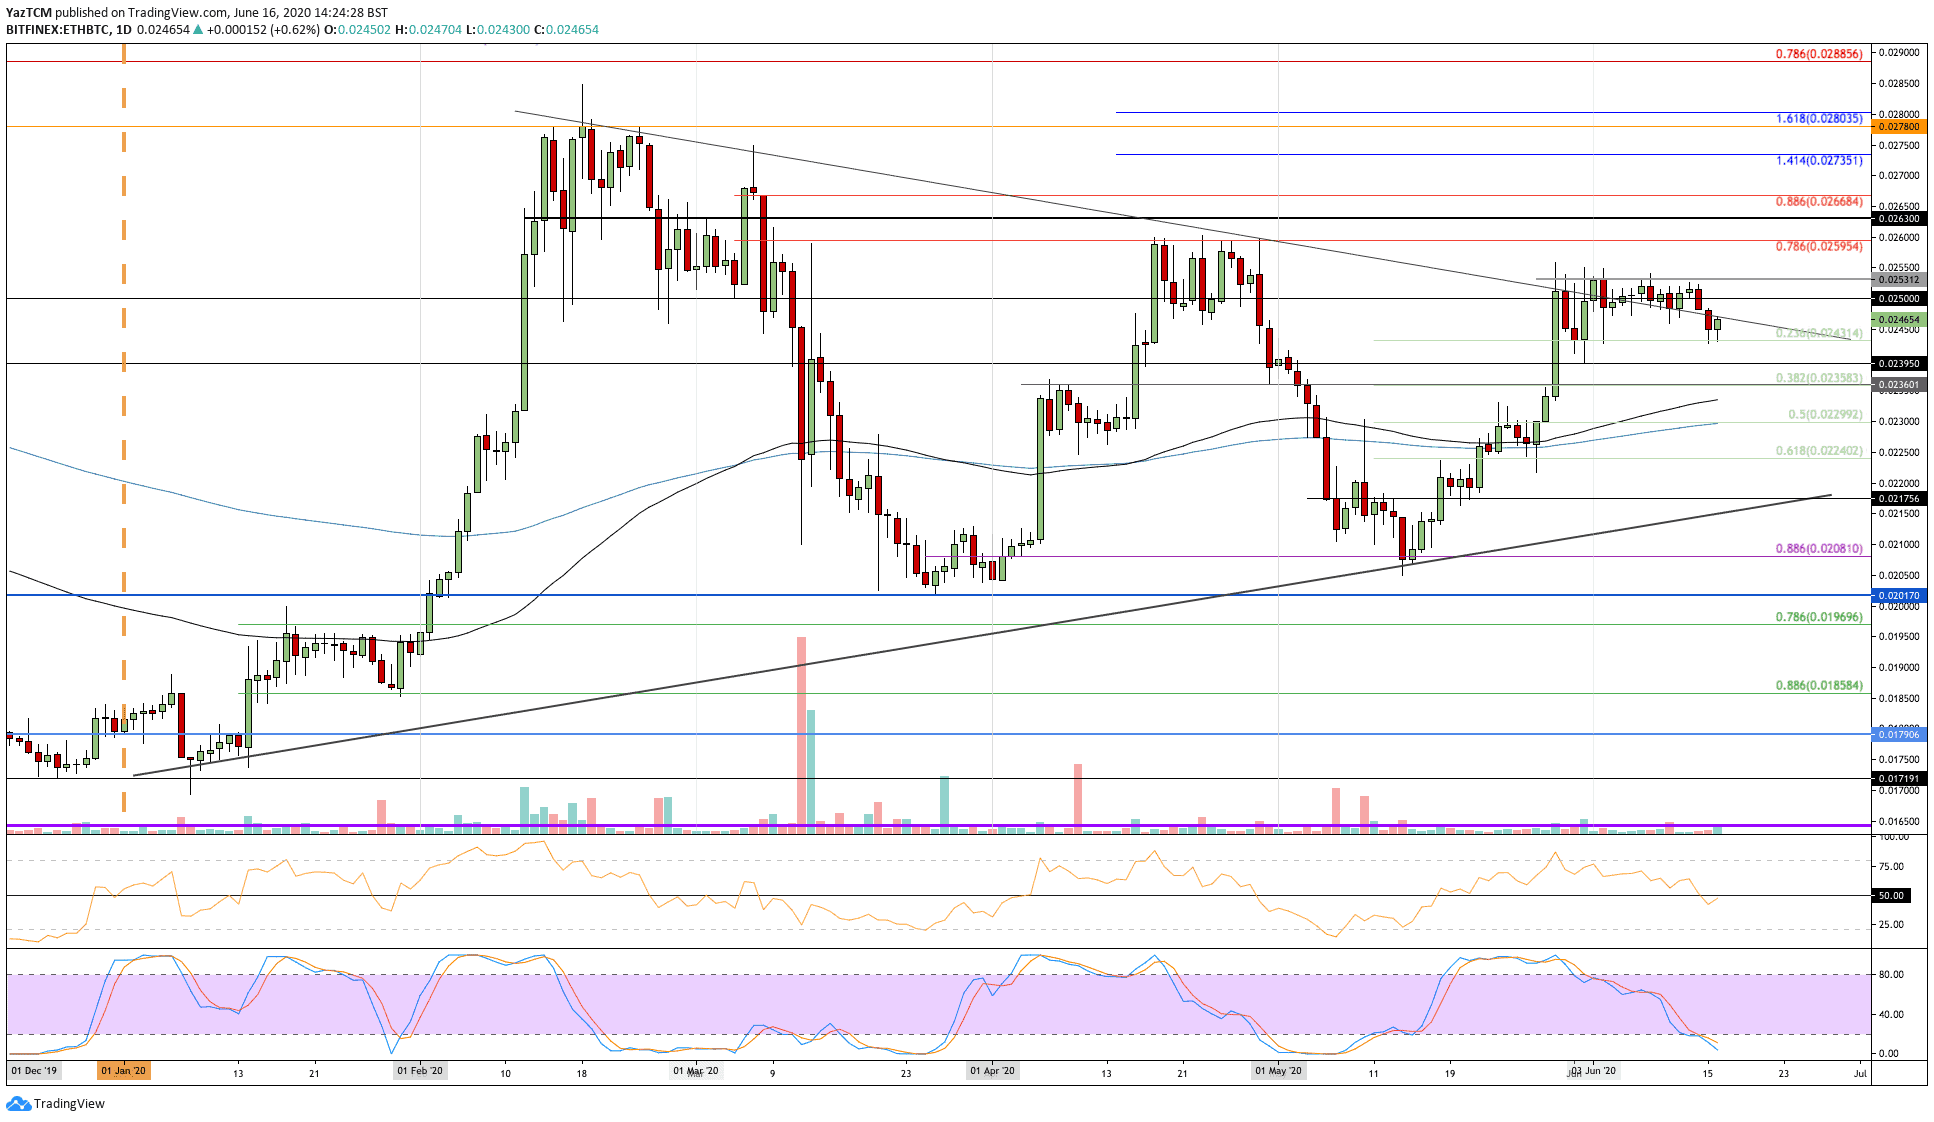
- Against Bitcoin, Ethereum fell into the support at 0.00243 BTC and rebounded from there.
Key Support & Resistance Levels
ETH/USD:
Support: $225, $215, $205.
Resistance: $250, $265, $274.
ETH/BTC:
Support: 0.025 BTC, 0.0243 BTC, 0.0235 BTC.
Resistance: 0.0253 BTC, 0.026 BTC, 0.0263 BTC.
ETH/USD: Ethereum Remains In Bullish Trend
Ethereum decreased by 6% yesterday, which caused it to briefly drop beneath the rising trend line that it has been trading above since mid-March 2020. However, the buyers quickly regrouped to push ETH back above it by the closing time to keep the bull trend intact.
ETH is now pushing higher as it looks to conquer the $235 level and re-test the $250. A break beneath this rising trend line would lead ETH to unwind lower toward $190.

ETH-USD Short Term Price Prediction
Looking ahead, the first level of resistance lies at $245 (bearish .786 Fib Retracement). This is followed by added resistance at $250, $265 (bearish .886 Fib Retracement), and $275.
On the other side, if the sellers break beneath the rising trend line, support lies at $225, $215 (.236 Fib Retracement), and $205 (100-day EMA).
The RSI is beneath the 50 line but is attempting to break above it. For ETH to continue toward $250, the RSI must rise past 50 to indicate bullish momentum within the market. Additionally, the Stochastic RSI is in overbought conditions and is primed for a bullish crossover signal.
ETH/BTC: ETH Falls To .236 Fib Retracement Support
Against Bitcoin, Ethereum fell beneath 0.025 BTC yesterday as it dropped into the support at 0.0243 BTC, which is provided by a .236 Fib Retracement. ETH rebounded from there today as it now trades at 0.0246 BTC.
A break beneath 0.0243 BTC would put ETH in a bearish trading condition again and would likely lead to a drop toward 0.023 BTC.

ETH-BTC Short Term Price Prediction
If the buyers continue to push higher, the first level of resistance lies at 0.025 BTC. Above this, resistance is found at 0.0253 BTC, 0.026 BTC (bearish .786 Fib Retracement), and 0.0263 BTC.
On the other side, if the sellers push lower, the first level of support is expected at 0.0243 BTC (.236 Fib Retracement). Beneath this, support lies at 0.0239 BTC and 0.0234 BTC (.382 Fib Retracement).
The RSI is also beneath the 50 line and must break above it for the buyers to take control of the market momentum.
The post ETH Looks Indecisive Despite 4% Daily Gains, More Pain Ahead? Ethereum Price Analysis appeared first on CryptoPotato.
The post appeared first on CryptoPotato


