- Cardano is performing relatively well following a sharp bounce from $0.0637
- The bounce was followed by a break out from a two weeks resistance line
ADA/USD: Cardano’s Price Rejects Near $0.085
Key Resistance Levels: $0.0846, $0.088, $0.0917
Key Support Levels: $0.074, $0.0688, $0.0631

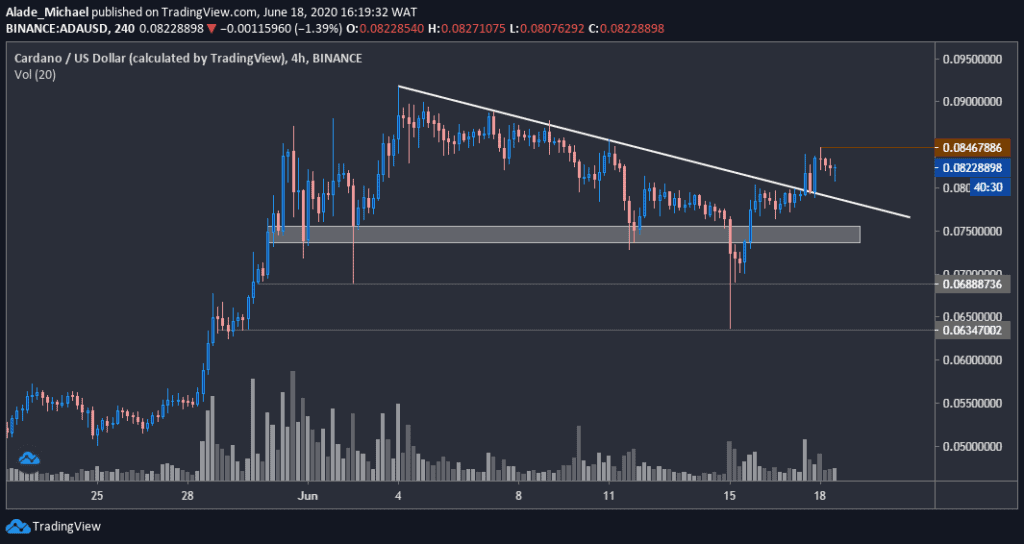
Cardano recently broke out from a two-week downtrend to reach $0.084 with small gains over the past hours. Тhe price has currently dropped to $0.815 after witnessing 0.30% losses. The current market structure shows that bulls might be looking to come back in the market.
Following the current drops, ADA’s likely to find support at $0.08 – around the white trend line before bouncing back. As can be seen on the chart, the volume and volatility have been quite low for some days now.
If Cardano finds a strong rebound around the mentioned price level, the price could see an increase towards the $0.0917 resistance – flagged as on June 4. A dump below the grey demand area of $0.074 might lead to a fake-out as bears could resume pressure in the market.
ADA Price Analysis
If such a scenario occurs, the price is likely to roll further to $0.0688 support, followed by the weekly low level of $0.063, indicated grey. It may floor at $0.05 level if the price continues to collapse.
Today’s high of $0.0846 would be the first target level for buyers if Cardano finds a close rebound around the white trend line. The next level to watch above the daily high is $0.088 and the $0.0917.
But as it stands now, Cardano is looking bullish following the recent breakout on the 4-hours time frame.
ADA/BTC: Cardano Looks For Support After Breakout
Key Resistance Levels: 897 SAT, 947SAT
Key Support Levels: 777 SAT, 704 SAT

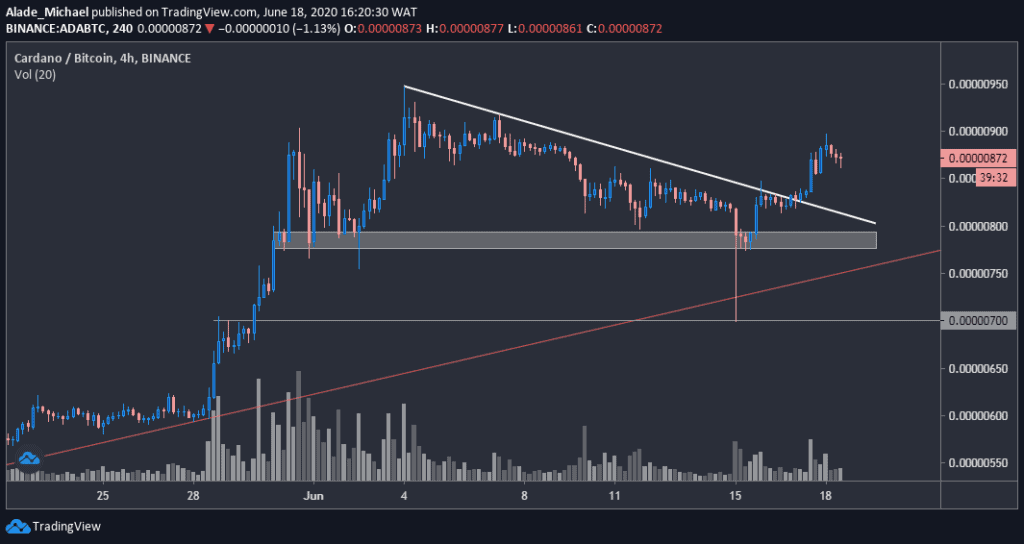
As predicted in the previous price analysis, Cardano did found support around 700 SAT. A sudden rejection from this level brought a quick 28% recovery in three days, followed by a break above a crucial resistance line that suspended bullish action for days.
After reaching a daily high of 897 SAT level, ADA dropped to where it is currently trading around 866 SAT.
The current pullback is a sign of healthy growth that could resume near 800 SAT shortly. Above the white resistance line, the price setup is currently looking bullish on the 4-hours chart.
Cardano Price Analysis
The current buying volume appears low on the price chart. The key level to watch is the monthly resistance of 947 SAT if buyers regroup above the current daily high of 897 SAT. 1000 SAT would be the next buy target once the monthly high is cleared.
Cardano is looking for a rebound around 800 SAT. Slightly below this level lies a grey demand zone of 777 SAT, near the red trend line. The next support is the 699 SAT level, where the price wicked on June 15.
The post Locked and Loaded, ADA Bulls Looks For a Bounce Around $0.08. Cardano Price Analysis appeared first on CryptoPotato.
The post appeared first on CryptoPotato


