
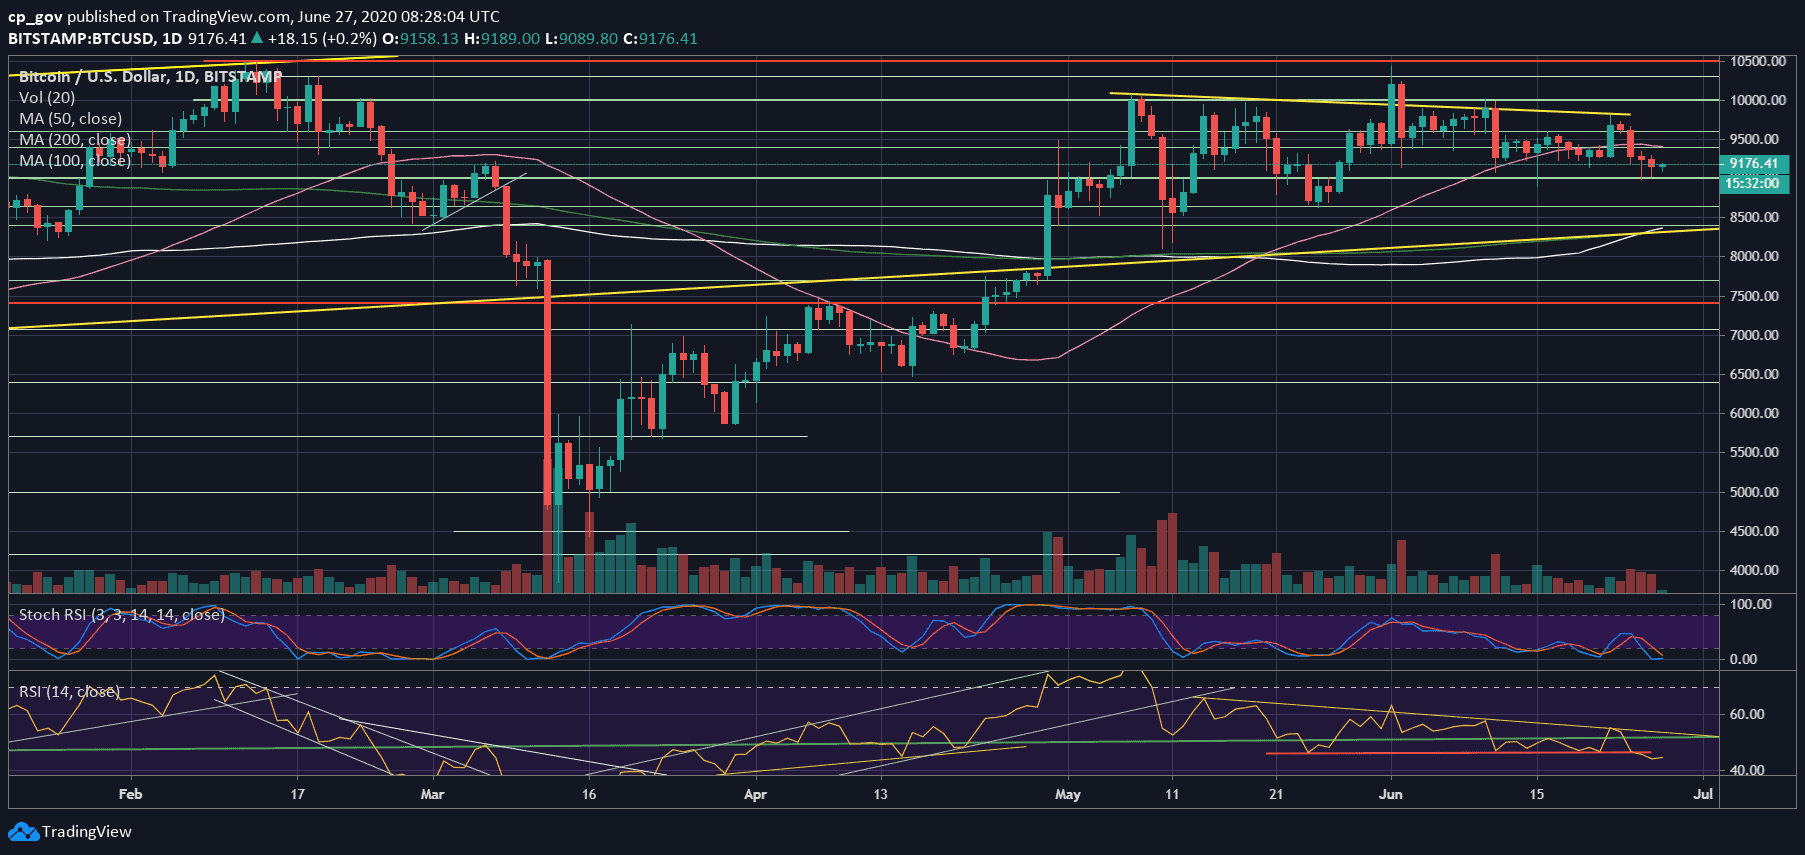
Only five days ago, the price of Bitcoin touched $9800, followed by another failure to break up the critical descending trend-line (marked yellow on the following daily chart).
Since then, the primary cryptocurrency had been correlating with the plunging global markets, and as of writing these lines, Bitcoin is trading slightly above $9000.
The Micro and Macro Level
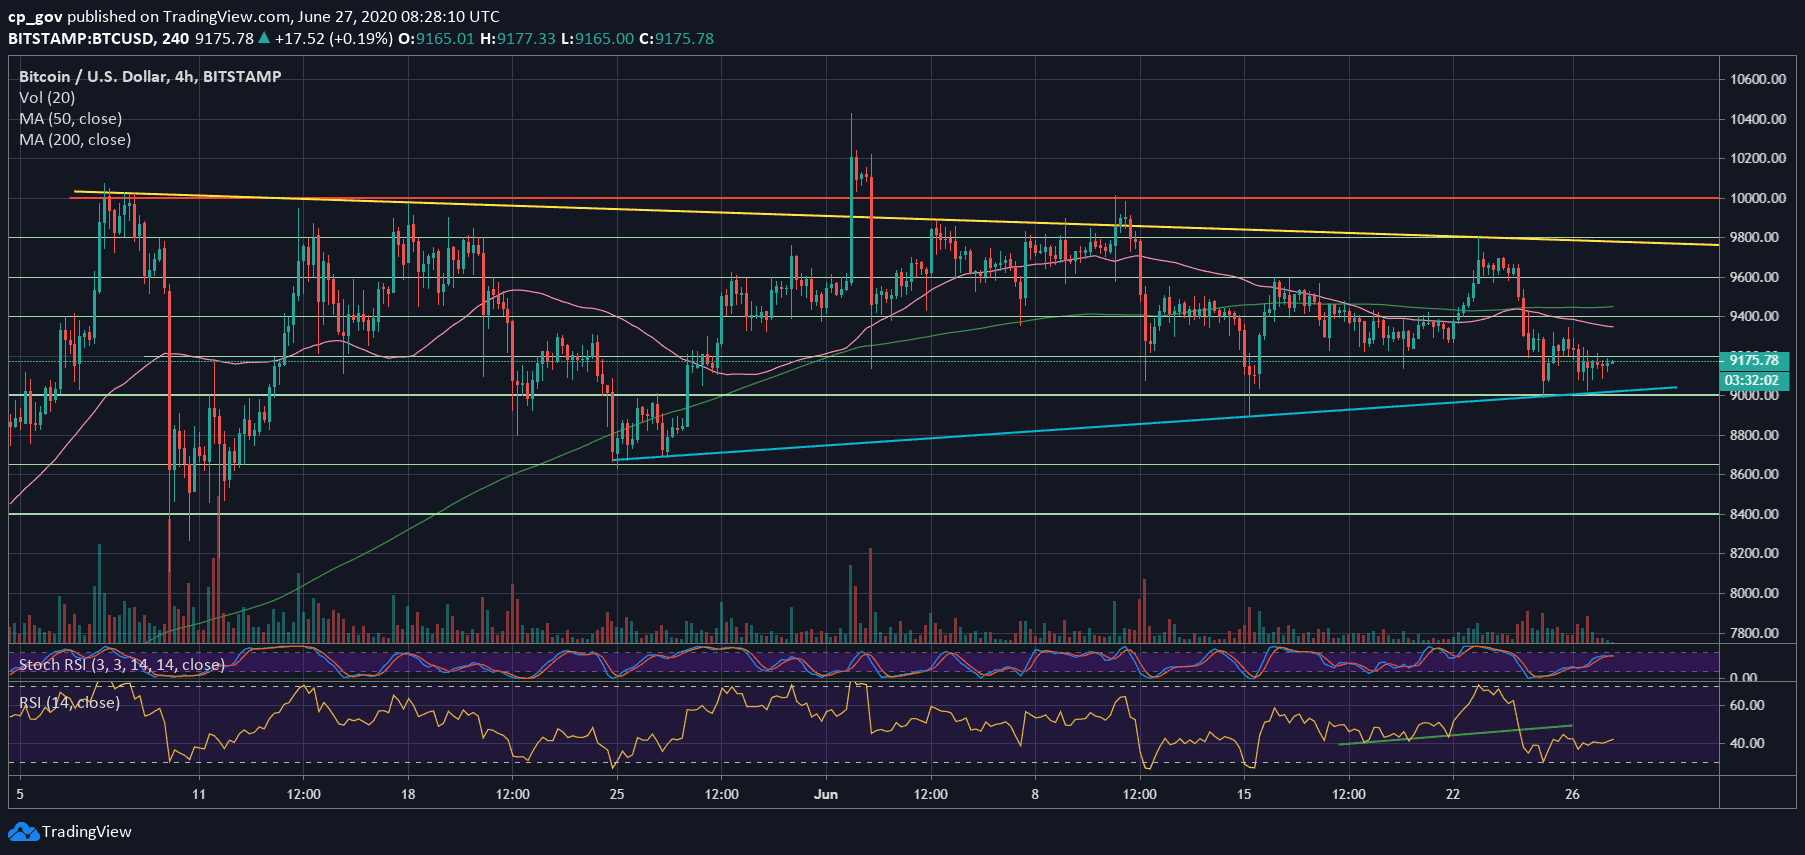
If we look at the micro-level, which is the following 4-hour chart, we can see that Bitcoin so-far holds the supporting blue line. As mentioned here two days ago, the $8900 – $9000 support level is the most crucial for the short term.
In case of a break-down, the bullish higher-lows trajectory will be invalidated.
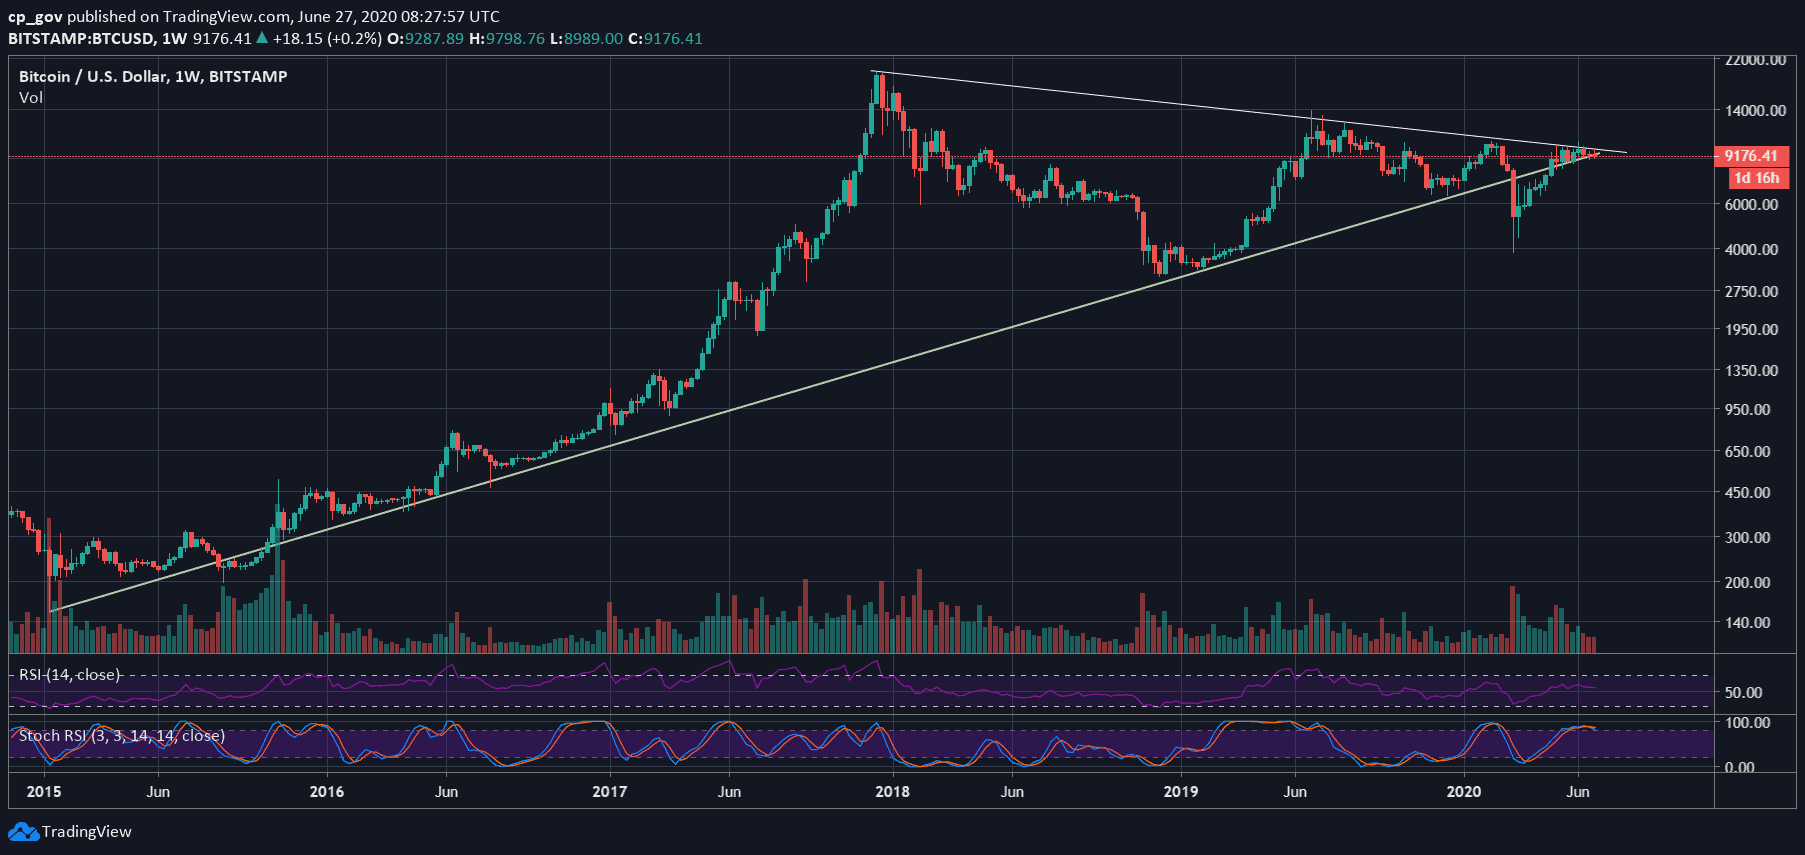
From the macro level, the weekly candle (as can be seen on the following chart) touched the long-term descending trend-line, which started forming since 2017.
At the same time, the current candle close is likely to take place below the supporting ascending trend-line, which started forming in 2015.
A weekly close (Sunday’s midnight) above $9400 is critical for the bulls. The last time this crucial line was broken, took place during the second week of March 2020 – the plunge from $8000 to $3600 in a matter of a few days.
Next Key Support & Resistance Levels
As mentioned above:
“the critical level is the $8900 – $9000 region (along with the blue ascending trend-line on the 4-hour chart). A breakdown here and Bitcoin is likely to revisit good old support levels.”
In case of a breakdown, then the next level of support lies at $8650. Further below is around $8300 – $8400, which also includes the significant 200 and 100 days moving average lines (marked light-green and white on the following daily chart).
The latter also includes the long-term yellow ascending trend-line as can be seen on the daily chart.
From above, the first major area of resistance lies around $9200. Further above lies at $9320 (Thursday’s high), followed by the 50-days moving average line (the pink line), which lies around $9400.
Total Market Cap: $262.7 billion
Bitcoin Market Cap: $169.5 billion
BTC Dominance Index: 64.5%
*Data by CoinGecko
BTC/USD BitStamp 4-Hour Chart
BTC/USD BitStamp 1-Day Chart
Click here to start trading on BitMEX and receive 10% discount on fees for 6 months.
Disclaimer: Information found on CryptoPotato is those of writers quoted. It does not represent the opinions of CryptoPotato on whether to buy, sell, or hold any investments. You are advised to conduct your own research before making any investment decisions. Use provided information at your own risk. See Disclaimer for more information.
The post appeared first on CryptoPotato


