If you’ve been in the cryptocurrency space for a while, you’ll know that the second most important coin in the market is Tether. While the categorization of the stablecoin under the tag “cryptocurrency,” much less “decentralized currency,” can be debated, its significance in the market cannot be understated.
As things stand, Tether [USDT], is the third-largest cryptocurrency in the market. That’s right, XRP, over the past few months, has been bogged down and pushed down to fourth. The reason for this rankings re-shuffle was the consistently high 24-hour trading volume of the stablecoin, which, according to Coinmarketcap, was $17.12 billion, $16 billion above XRP and $4 billion above Bitcoin, at the time of writing.
Further, Tether, unlike Bitcoin, does not have a “hard cap” i.e. it is not exhaustible and its current circulating supply is at 9.18 billion USDT.
Tether’s rising use cases within the cryptocurrency market come from the stablecoin being used as a trading pair for Bitcoin and altcoin trades on several exchanges. Given this link, there’s often been a correlation [not causation] between the printing of USDT and a massive movement in the price of Bitcoin.
With this in mind, think back to the Bitcoin recovery in the recently concluded Q2 2020. Coming into April, Bitcoin was trading below $5,500, down by 28 percent in the month. But by the end of the quarter, it was trading over $9,000. This recovery wasn’t stretched out either as within a space of 5 weeks, Bitcoin jumped from $5,500 to over $8,500.
During this recovery period, one would expect trading to be high, especially trading in the base pair USDT. While Tether’s daily trading volume did go as high as $95 billion during some days in the recovery period, as a proportion to its market, it could’ve or rather should’ve been higher.
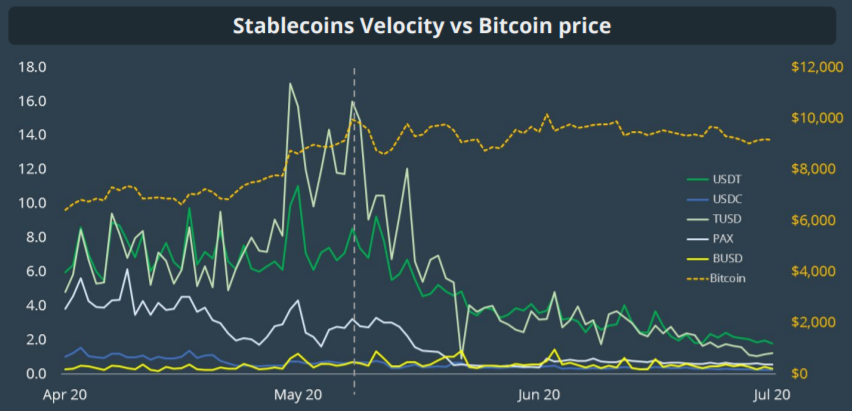
According to CoinGecko’s quarterly report for Q2 2020, the ‘stablecoin velocity’ during the recovery saw TrueUSD overtake USDT. The report measured ‘velocity’ as a stablecoin’s volume in terms of its market capitalization i.e. volume/market cap, underlining “how widely traded a stablecoin is relative to its market cap.”
The report went on to state that the increase in velocity during the recovery was evidence of traders engaging in arbitrage trading, adding that the subsequent decrease was due to hodling.
“From mid-May onwards, as Bitcoin price stabilizes, velocity of stablecoins dropped significantly. This indicates a likely behavior shift from trading to HODL-ing.”
As per the attached chart, the only stablecoin which competed with USDT in velocity between April to June 2020 was TUSD. In April, their respective velocities ranged between 6 to 8, but by the end of the month, when Bitcoin rose to $8,000, TUSD’s velocity jumped to a high of 16, while USDT only managed to briefly move above 10.
With the price stabilizing in May and June, the velocities began to decrease as trading volume declined. However, TUSD still managed to keep pace with USDT, moving below only in late-June.
USDT is still the undisputed king of the stablecoin market, accounting for 86.2 percent of the stablecoin market capitalization and 96.7 percent of the trading volume, compared to TUSD’s 2.2 percent market cap and 0.8 percent volume. But, the velocity metric suggests that despite the small market cap, TUSD is seeing higher proportionate volume compared to the king stablecoin.
Your feedback is important to us!
The post appeared first on AMBCrypto


