Disclaimer: The findings of the following analysis attempt to study the price trend evolving in the Ethereum market
Ethereum, the world’s largest altcoin, was priced at $238 at the time of writing, with ETH testing the $240 level, but with no luck. Trading in a strong sideways channel since May, the top altcoin followed in the footsteps of Bitcoin by trading within a tight range, while less valuable altcoins like Cardano and Chainlink were making massive gains in the market.
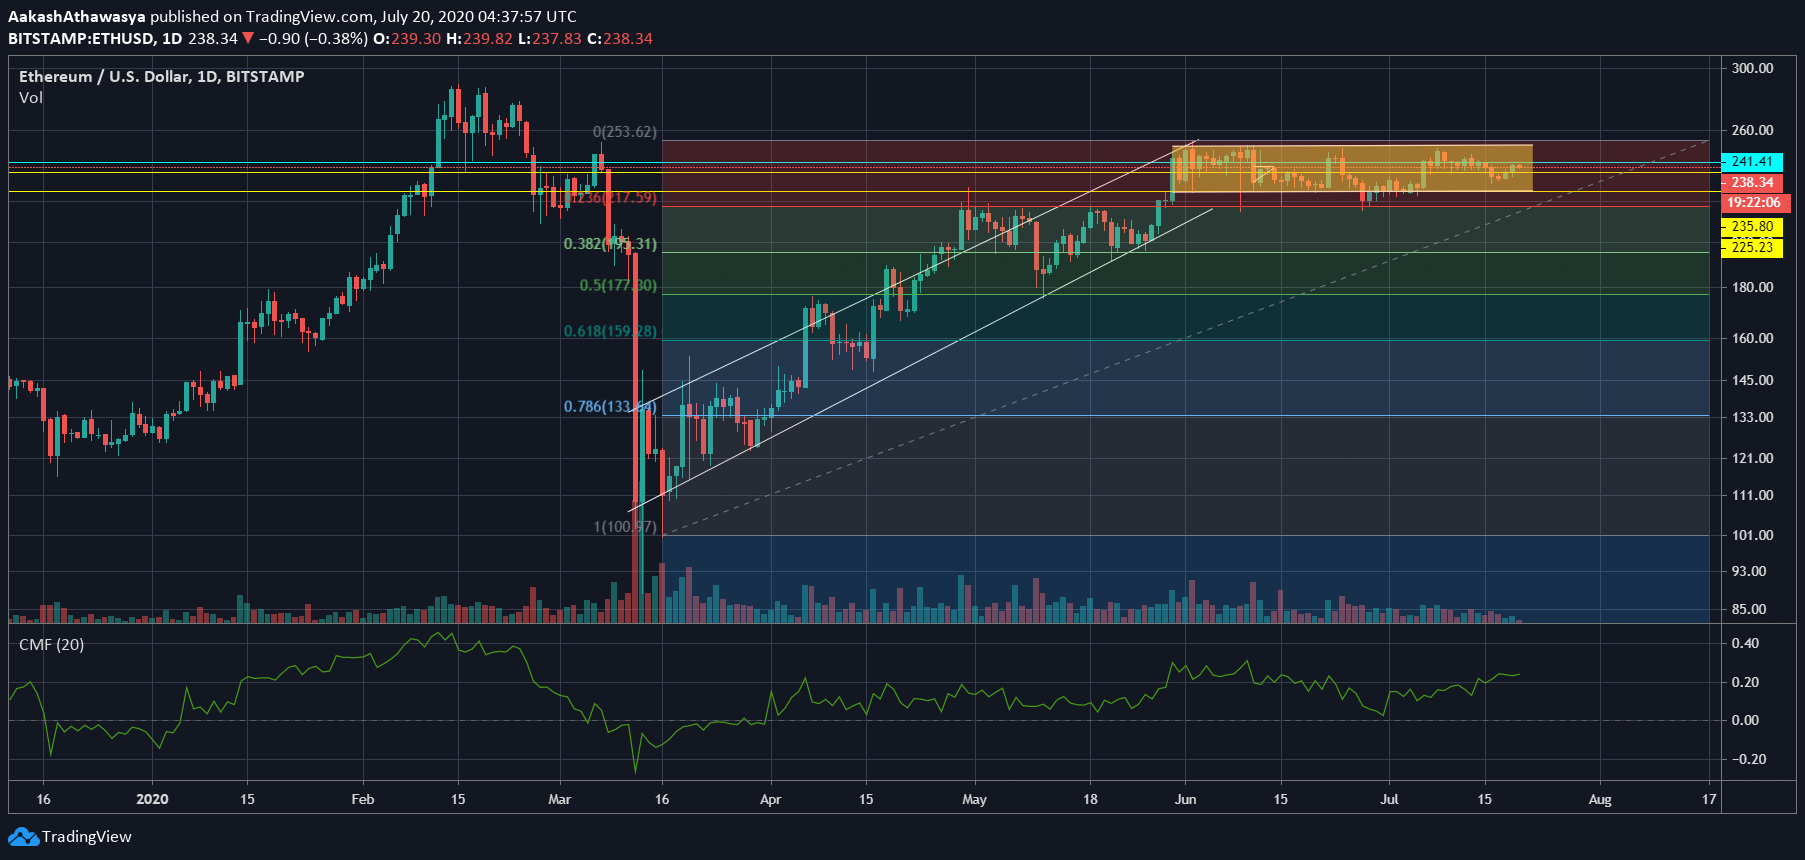
Since dropping to a low of $110, in March, with some rouge trades on top exchanges in the double digits, ETH has mounted a strong recovery. Unlike Cardano which saw its uptrend punctuated by sideways movement, Ether’s rise was more or less straightforward – $133 on April 1, $217 on May 1, and $252 on June 1. However, since breaching the $250-level, the price has started to go on a fit of tight trading.
On the daily chart, a parallel channel was observed between support at $225 to resistance at $255, one that mimics Bitcoin’s parallel channel between $8,800 to $10,000, with only brief skirmishes above for the highest-ranked coins in the market. Further, the Fibonacci retracement suggested that Ether was trading in the top tier, with the next support beyond $225 lying at $215.
A positive sign, amid this time of tight trading for the altcoin, was the rising Chaikin Money Flow indicator. Since the beginning of the month, the CMF has risen from 0.02 to 0.24, its highest point in over the month. This injection of money has, however, been devoid of trading volume as the 24-hour trade volume for ETH, according to CoinMarketCap, stood at $6.32 billion, whereas a few days ago it was at $7.9 billion.
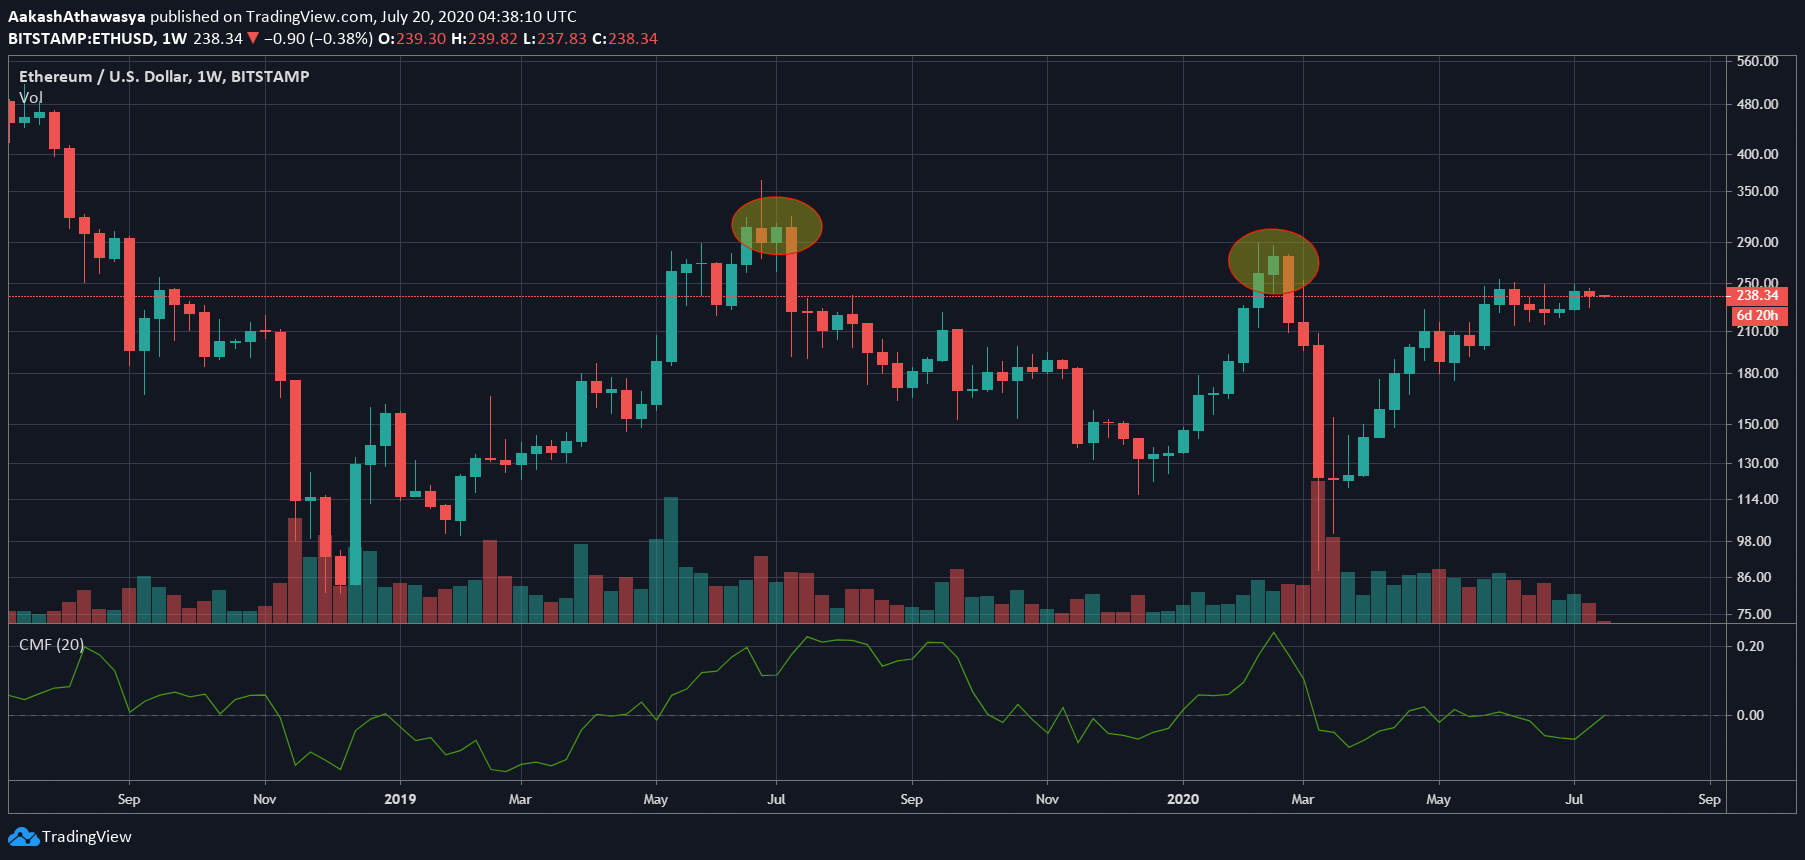
The weekly chart also pointed to an increasingly worrying state for Ethereum as it has, in the last 12 mounts, mounted two lower highs at $300 and $275, respectively, with the next likely to be at the present price point. This, coupled with the persisting parallel channel and the decreasing volume, could push the price lower, despite an increase in money inflow.
If the price does push lower, the key levels to look at are the lower Fib levels at $218, $197 and $177. However, given the centered nature of Ethereum’s price to Bitcoin, the latter should be looked at closer in expectation of a move in the former.
The post appeared first on AMBCrypto


