Bitcoin
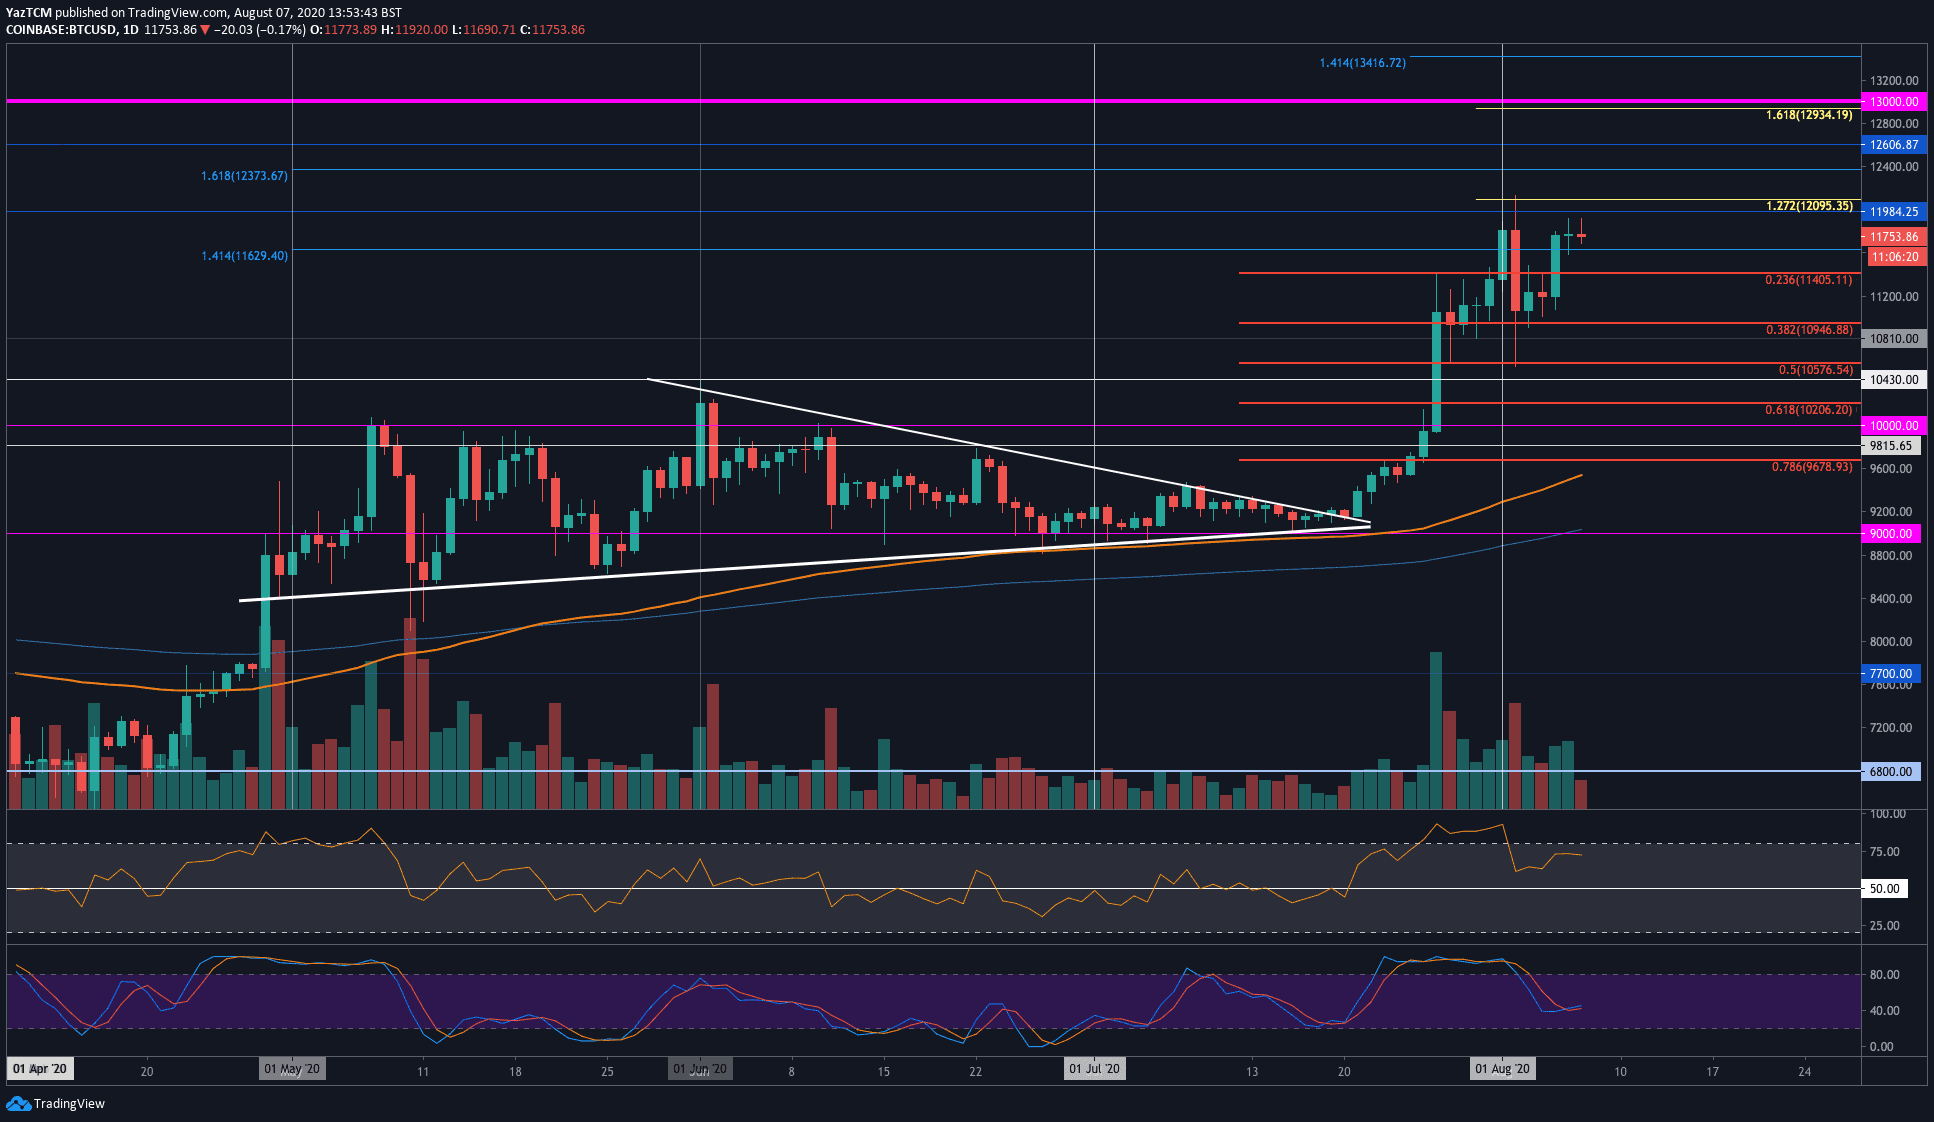
Bitcoin saw a 5% price rise this week as it reached the $11,750 level. The cryptocurrency started the week at the $11,400 level as it pushed higher into $12,095 on August 2nd. From there, Bitcoin experienced some major volatility as it dropped by $1,400 in just a few minutes to fall into the $10,575 (.5 Fib Retracement) level.
Bitcoin rebounded from there and started to grind higher again over the week as it reached the $11,750 level today.
Looking ahead, if the buyers push higher, the first level of resistance is at $12,000. This is then followed by resistance at $12,100 (1.272 Fib Extension), $12,400, $12,600, and $13,000.
On the other side, support is expected at $11,400 (.236 Fib Retracement), $11,200, $10,950 (.382 Fib Retracement), and $10,810.
Ethereum
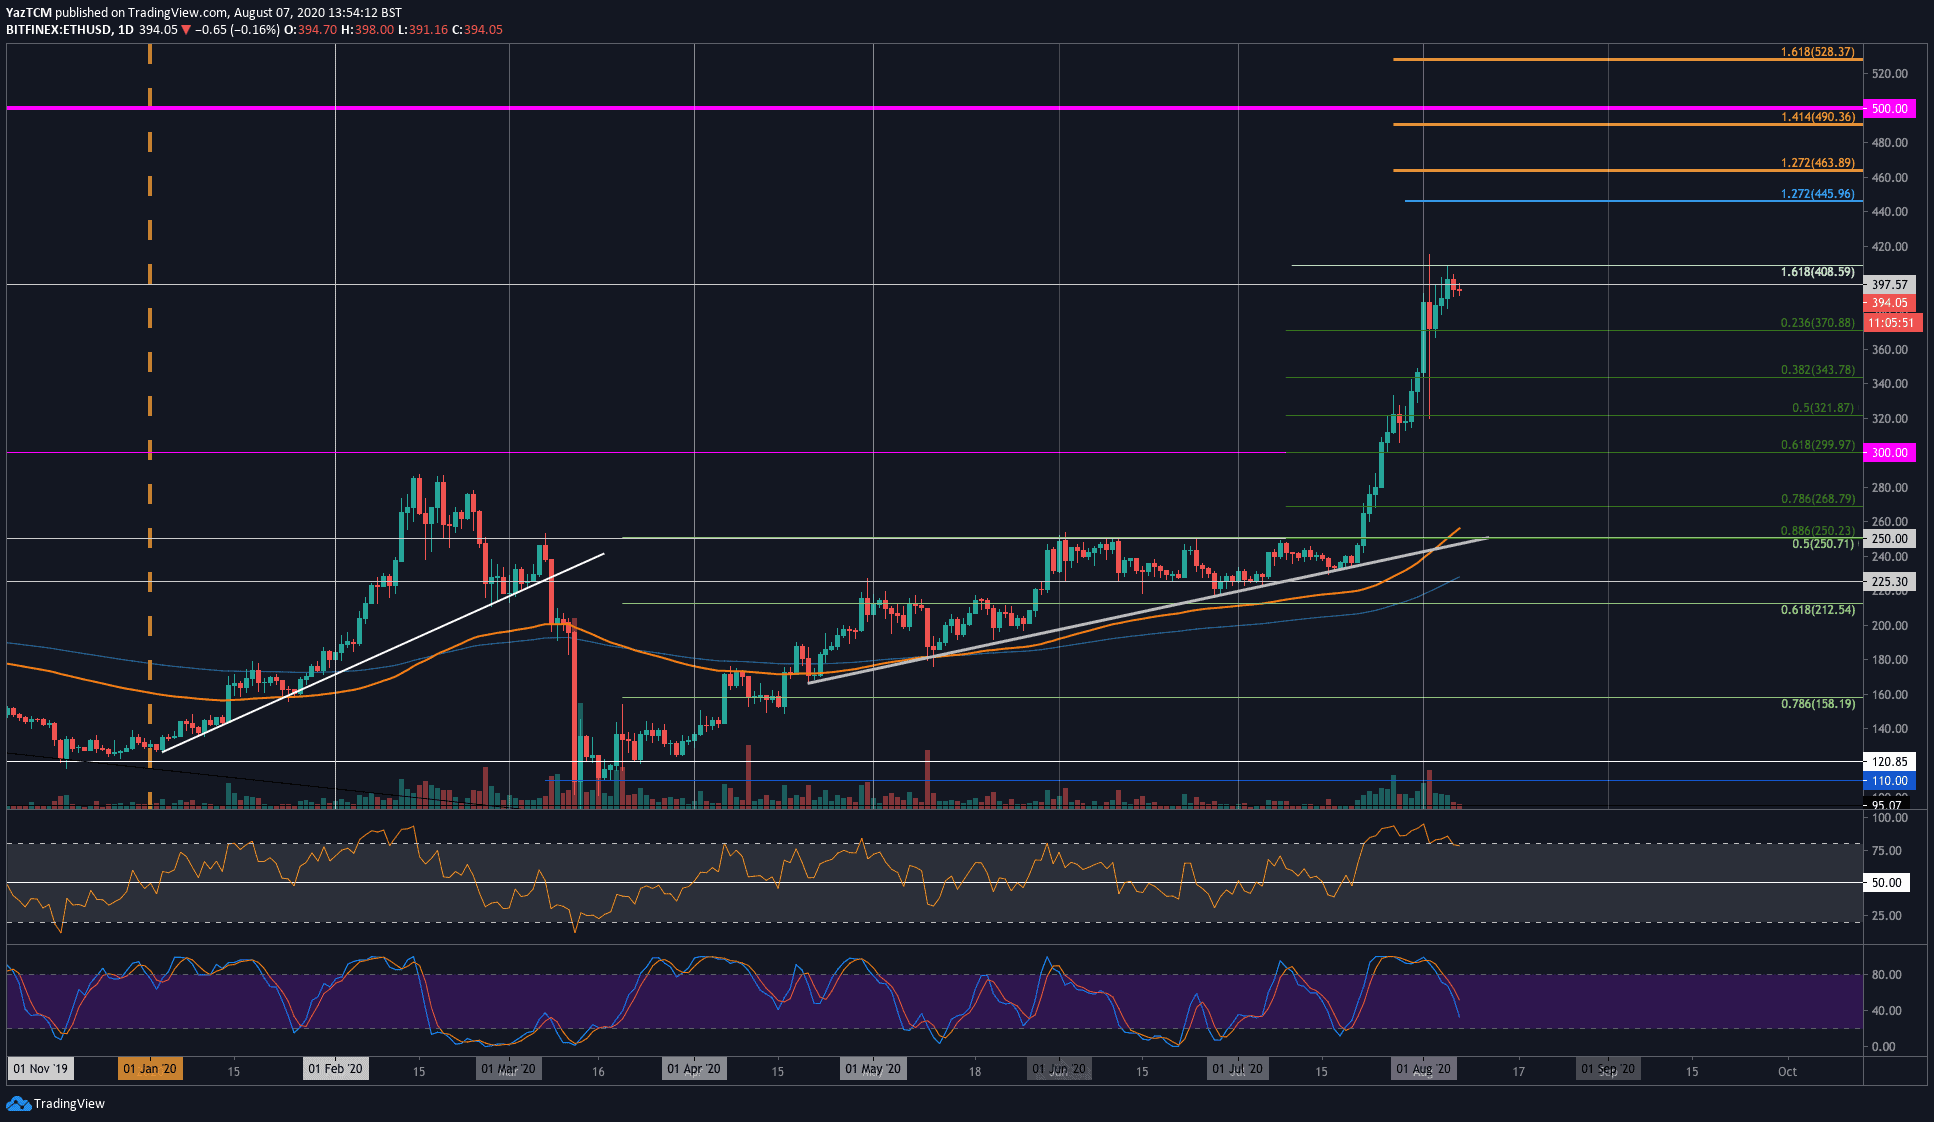
Ethereum saw a strong 15.5% price surge this week as the coin trades at $395. ETH started the week beneath the $350, and it started to push higher. It managed to reach $410 on August 2nd, but the volatility seen in Bitcoin caused it to dip as low as $321.
Ethereum quickly recovered from this spike and went on to finish August 2nd by closing above the .236 Fib Retracement at $370. From there, ETH slowly moved higher again as it reached $408 (1.618 Fib Extension). It was still unable to close above $400, which caused the coin to head lower into the current $385 level.
Moving forward, if the buyers can push above $400, the first level of resistance lies at $408 (1.618 Fib Extension). This is followed by resistance at $430, $446, $465 (1.272 Fib Extension), and $490 (1.414 Fib Extension).
On the other side, the first level of strong support lies at $370 (.236 Fib Retracement). This is followed by support at $343 (.382 Fib Retracement), $321 (.5 FIb Retracement), and $300 (.618 Fib Retracement).
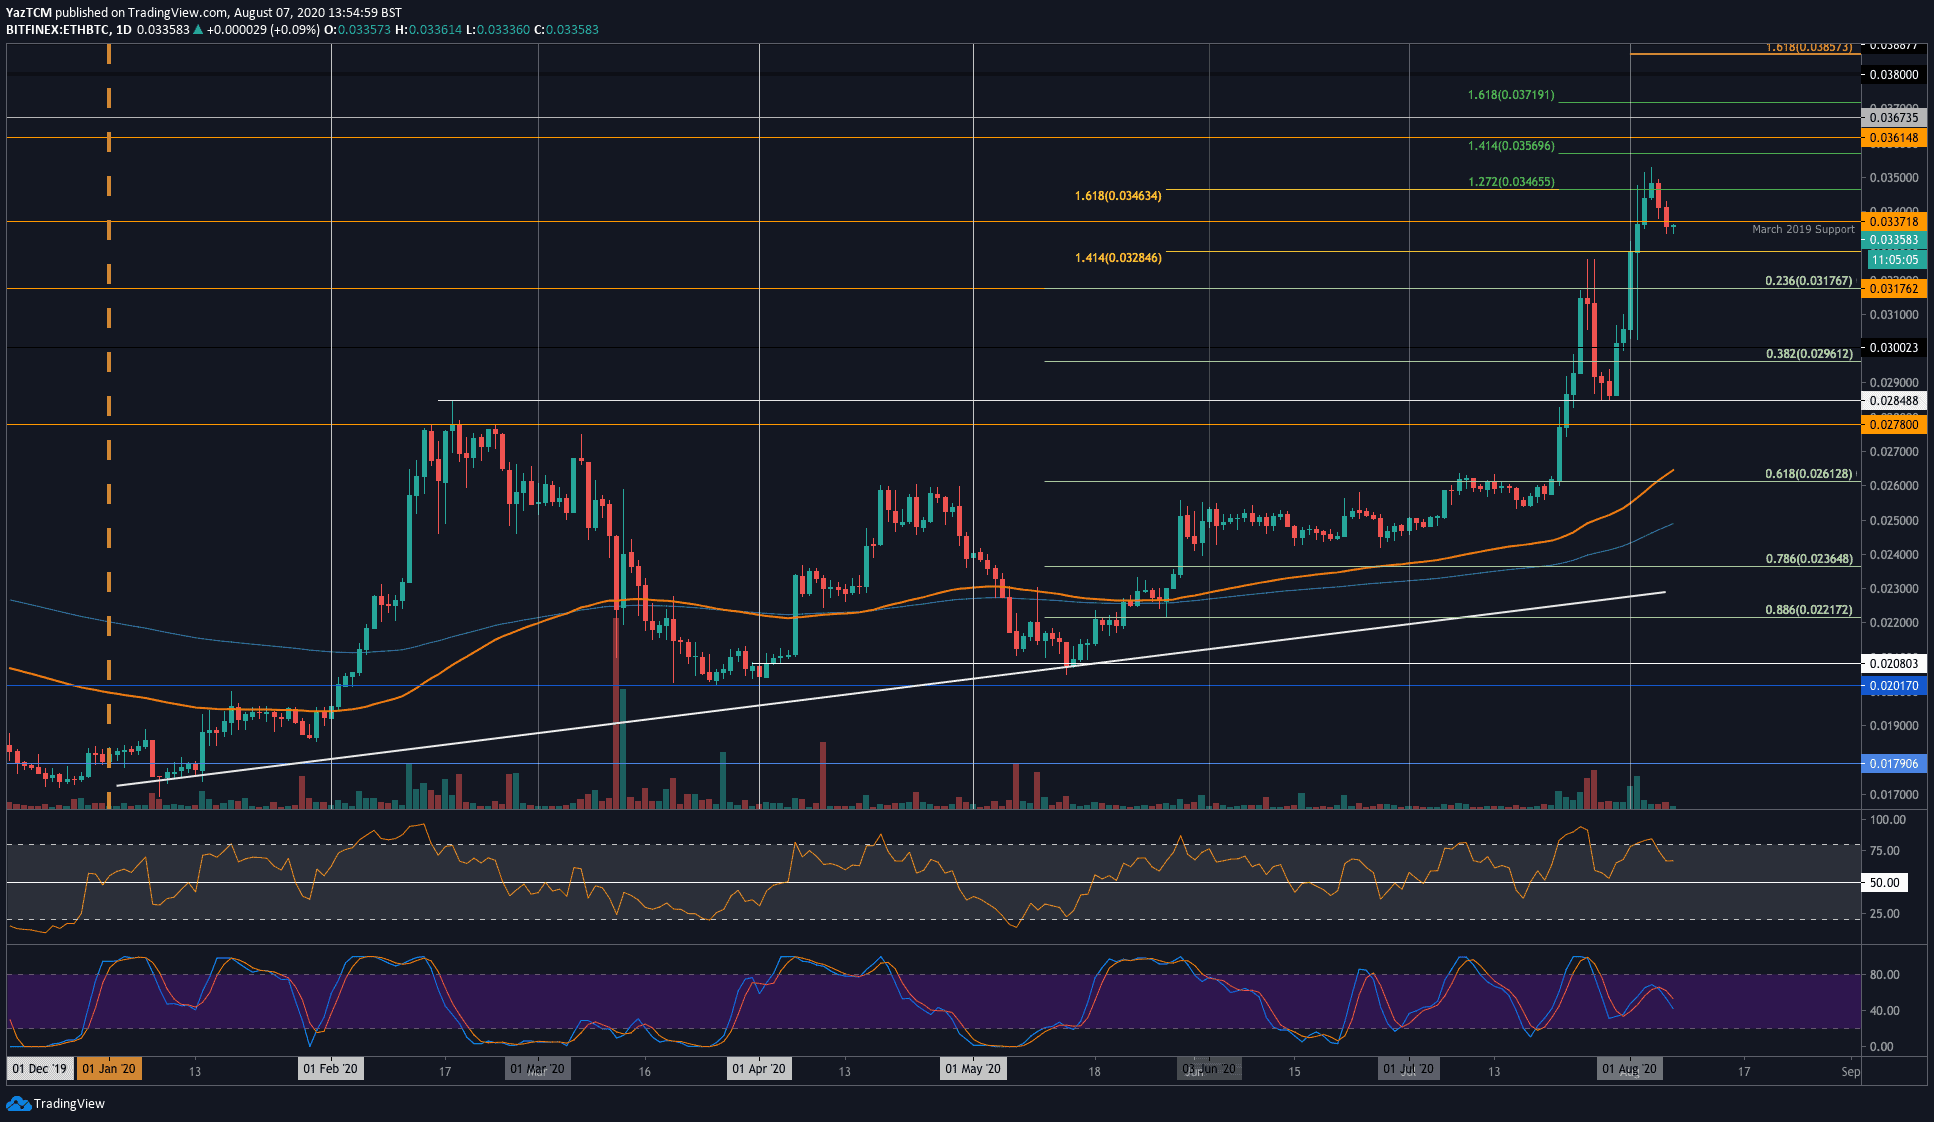
Against Bitcoin, Ethereum is also performing remarkably well as the coin trades at 0.0335 BTC. It started the week beneath the 0.031 BTC level as it pushed higher to reach 0.035 BTC. It was unable to overcome this resistance, which caused it to roll over and head lower over the past couple of days as it hits the 0.0335 BTC level.
Looking ahead, if the bulls regroup and push higher, the first level of resistance lies at 0.0337 BTC (March 2019 Support). This is followed by resistance at 0.0346 BTC (1.272 Fib Extension), 0.035 BTC, and 0.0361 BTC.
On the other side, the first level of support lies at 0.0328 BTC. Beneath this, added support is found at 0.0317 BTC (.236 Fib Retracement), 0.031 BTC, and 0.0296 BTC (.382 Fib Retracement).
Ripple
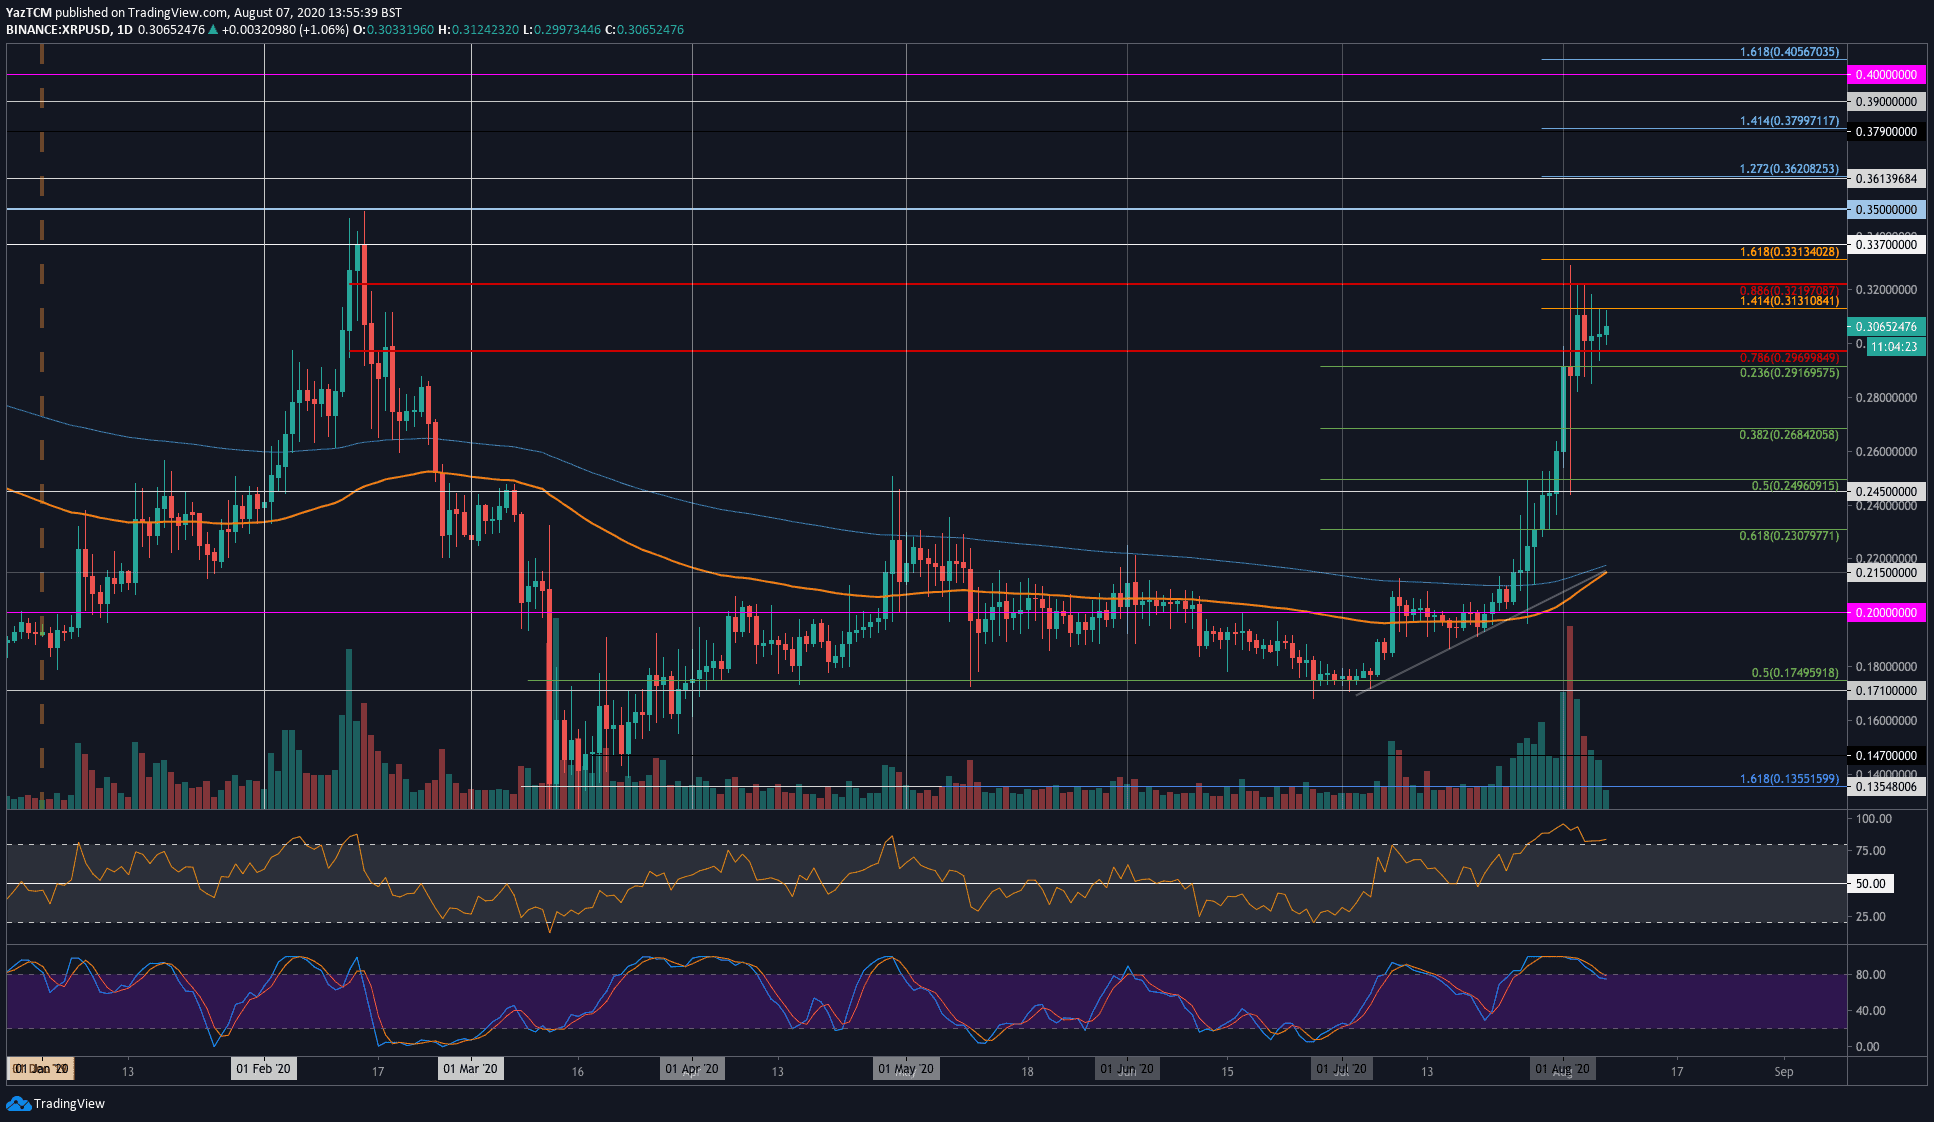
XRP saw a very strong 24% price explosion this week as it reached the $0.306 level. The coin was trading at $0.26 at the start of the week as it surged higher to reach the $0.321 level (bearish .886 Fib Retracement). More specifically, XRP was unable to close above resistance at $0.313 (1.414 Fib Extension).
The coin has been trading between $0.3 and $0.313 over the past 4-days and must break this range to dictate the next direction of the market.
If the bulls can break above $0.313 and $0.321, additional resistance is expected at $0.331 (1.618 Fib Extension), $0.337, and $0.35.
On the other side, support lies at $0.3. Beneath this, added support lies at $0.291 (.236 Fib Retracement), $0.28, and $0.268 (.382 Fib Retracement).
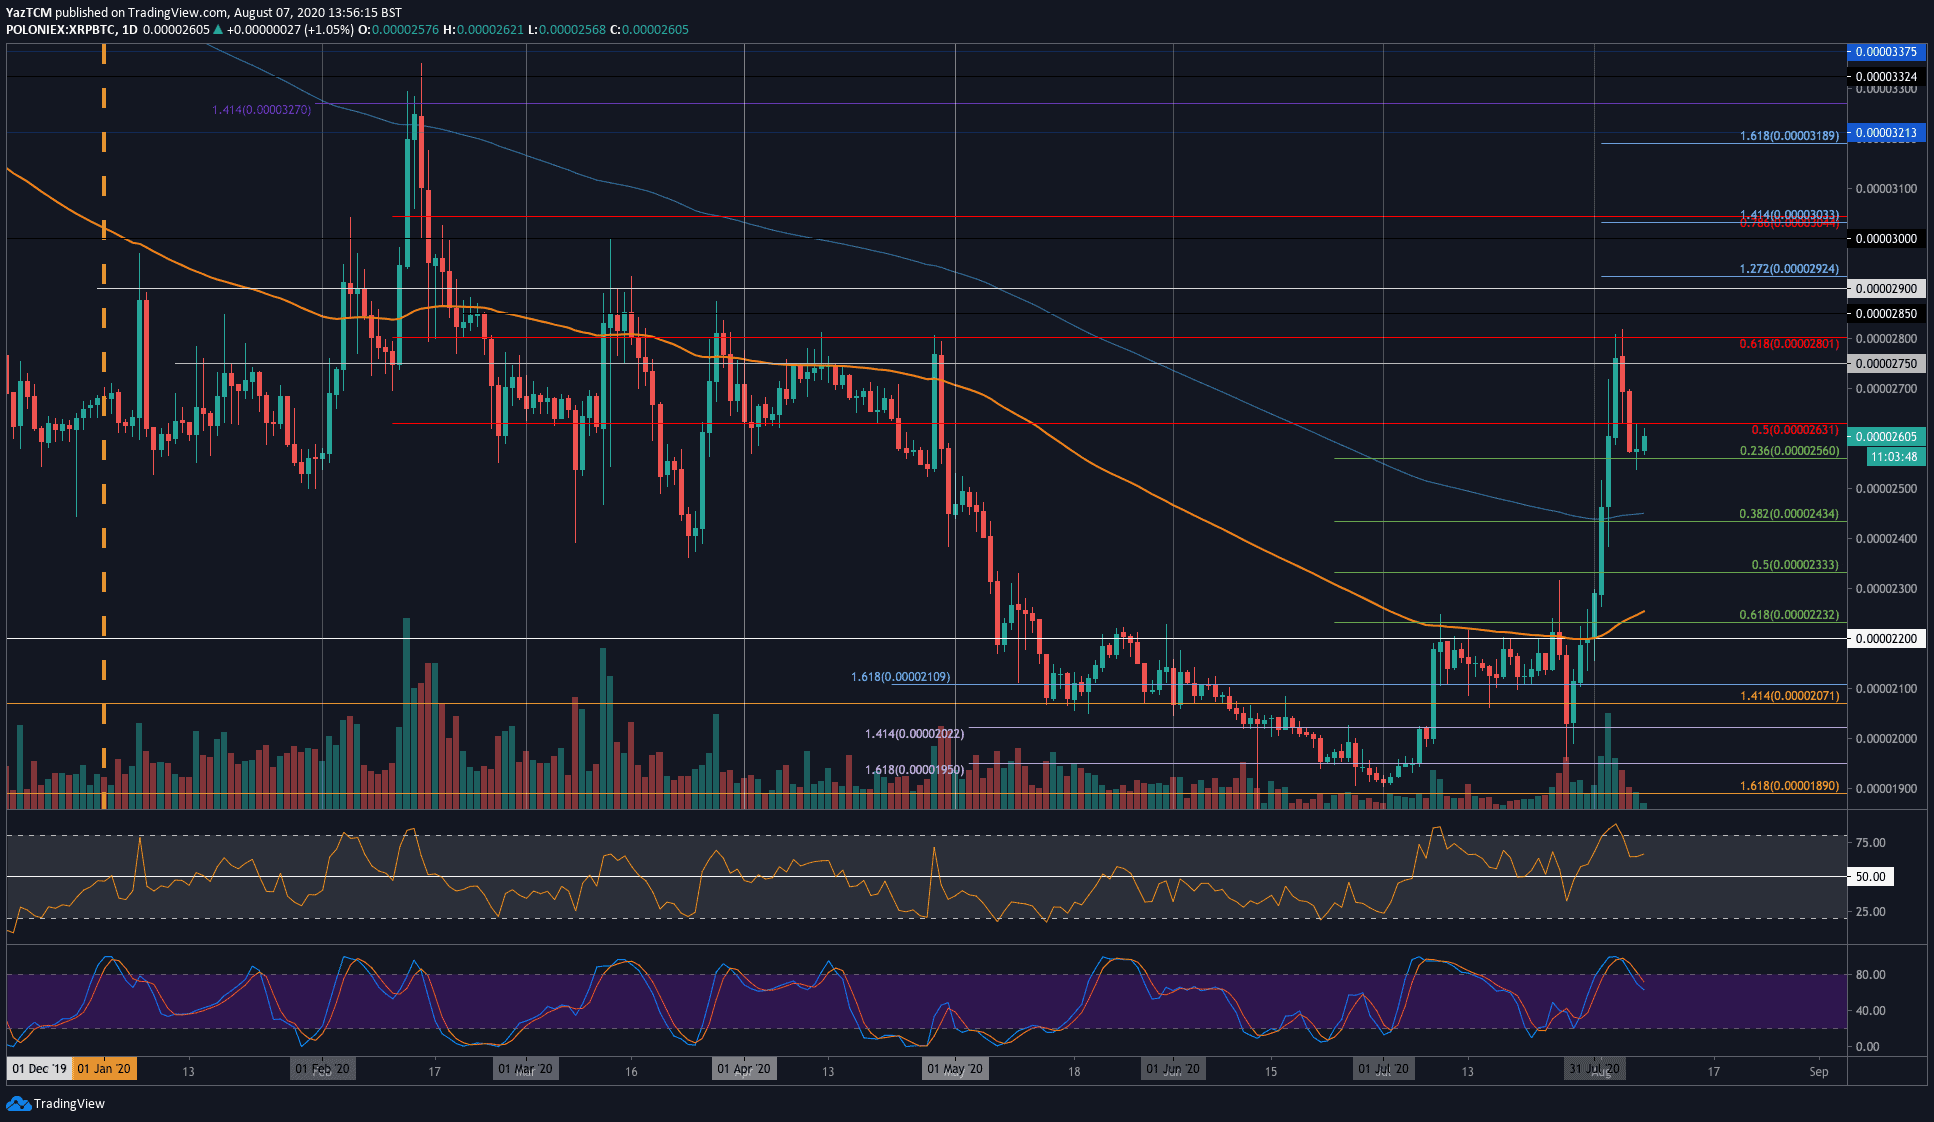
XRP has also shown some major signs of recovering against Bitcoin this week as the coin surged from 2200 SAT to break above the 200-days EMA at 2435 SAT and reach the 2800 SAT level (bearish .618 Fib Retracement). XRP has since dropped slightly into the support at 2560 SAT (.236 Fib Retracement).
Looking ahead, if the bulls push higher, the first level of resistance is expected at 2630 SAT (bearish .5 Fib Retracement). Following this, resistance lies at 2750 SAT, 2800 SAT (bearish .886 Fib Retracement), and 2900 SAT (April 2020 highs).
On the other side, the first level of strong support lies at 02560 SAT (.236 Fib Retracement). Beneath this, added support lies at 2500 ST, 2430 SAT (200-days EMA & .382 Fib Retracement) and 2333 SAT (.5 Fib Retracement).
Tezos
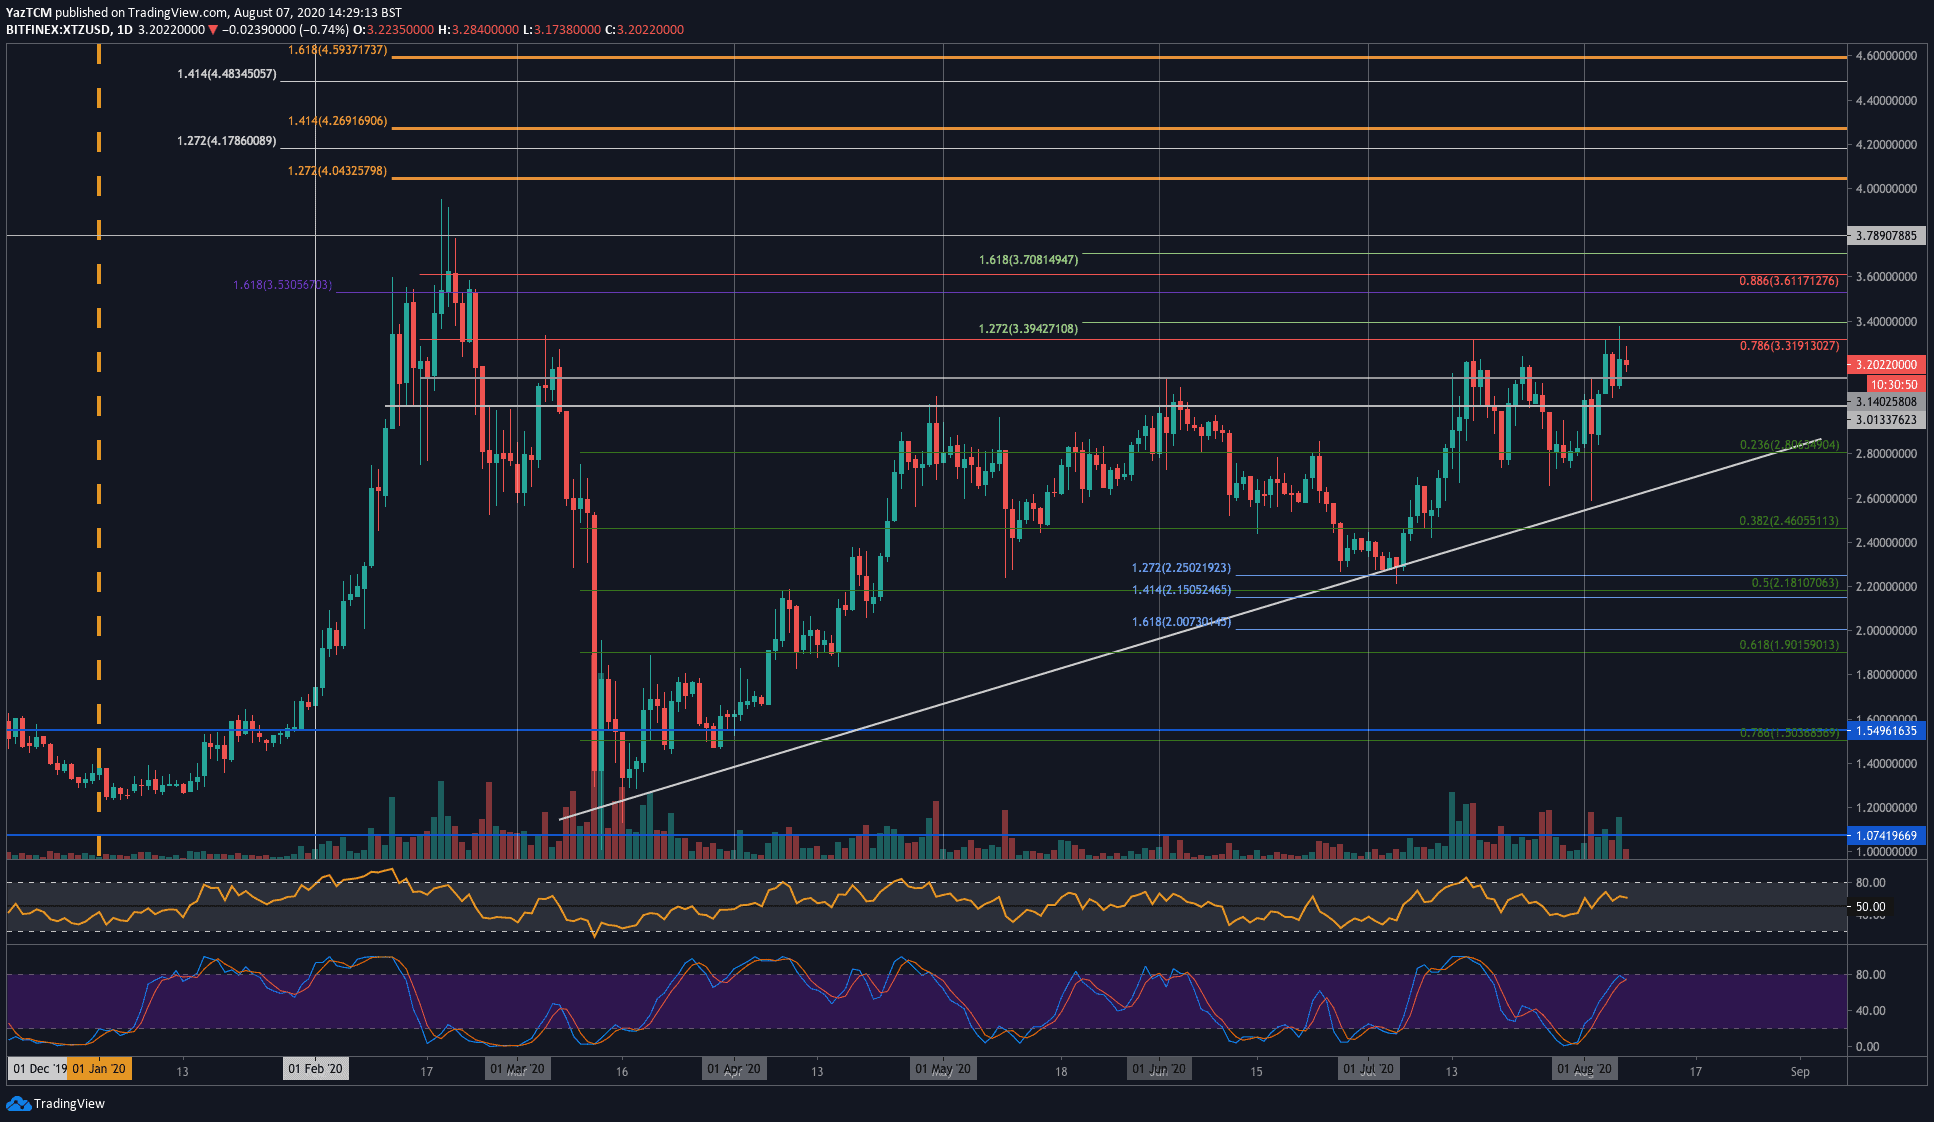
Tezos saw a 12.5% price rise this week as the coin reached the $3.20 level. XTZ started the week by trading at $2.80 as it pushed higher into the $3.31 (bearish .786 Fib Retracement) resistance. This resistance also caused trouble for the coin during July as it was rejected here.
It was once again unable to overcome this resistance as the coin headed back into the $3.10 support. It has since bounced higher to trade at $3.20.
Looking ahead, if the buyers push higher, the first level of resistance lies at $3.31. This is followed by resistance at $3.39 (1.272 Fib Extension), $3.61 (bearish .886 Fib Retracement) and $3.70 (1.618 Fib Extension).
On the other side, support lies at $3.14, $3.00, and $2.80 (.236 Fib Retracement).
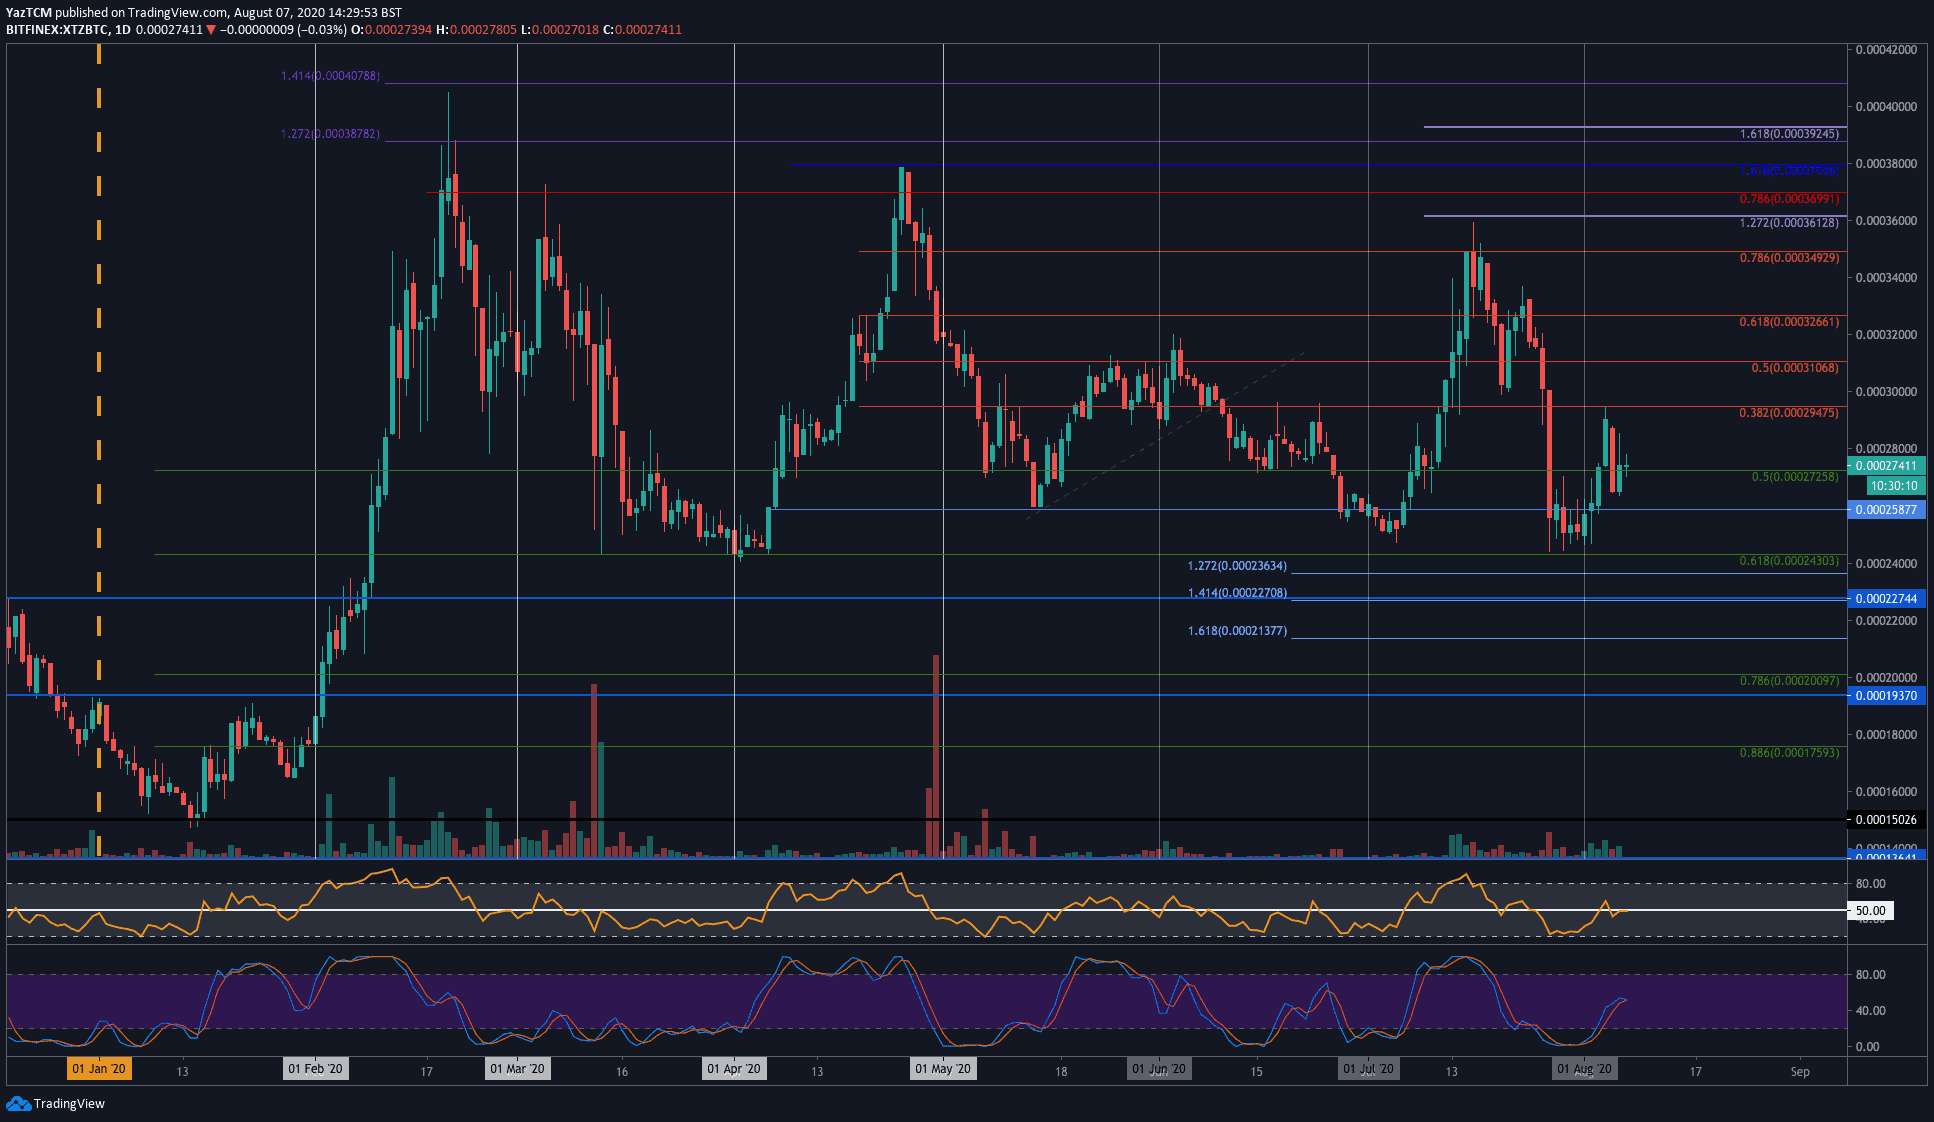
Tezos is in a slightly different situation against Bitcoin. It had surged as high as 34,900 SAT during July 2020, where it met resistance at a bearish .786 Fib Retracement. From there. XTZ rolled over and dropped aggressively until support was found at 24,300 SAT (.618 Fib Retracement) at the start of August.
During this week, XTZ pushed higher into the 29,500 SAT resistance provided by a bearish .382 Fib Retracement. It failed to break this level, which caused it to head lower into the current 27,400 SAT level.
Moving forward, the first level of resistance to break lies at 29,500 SAT (beraish .382 Fib Retracement). Above 30,000 SAT, resistance is expected at 31,000 SAT (bearish .5 Fib Retracement), and 32,600 SAT (bearish .618 FIb Retracement).
On the other side, the first level of support is expected at 25,900 SAT. Beneath this, support lies at 25,000 SAT, 24,300 SAT *.618 Fib Retracement), 23,600 SAT, and 22,700 SAT.
Elrond
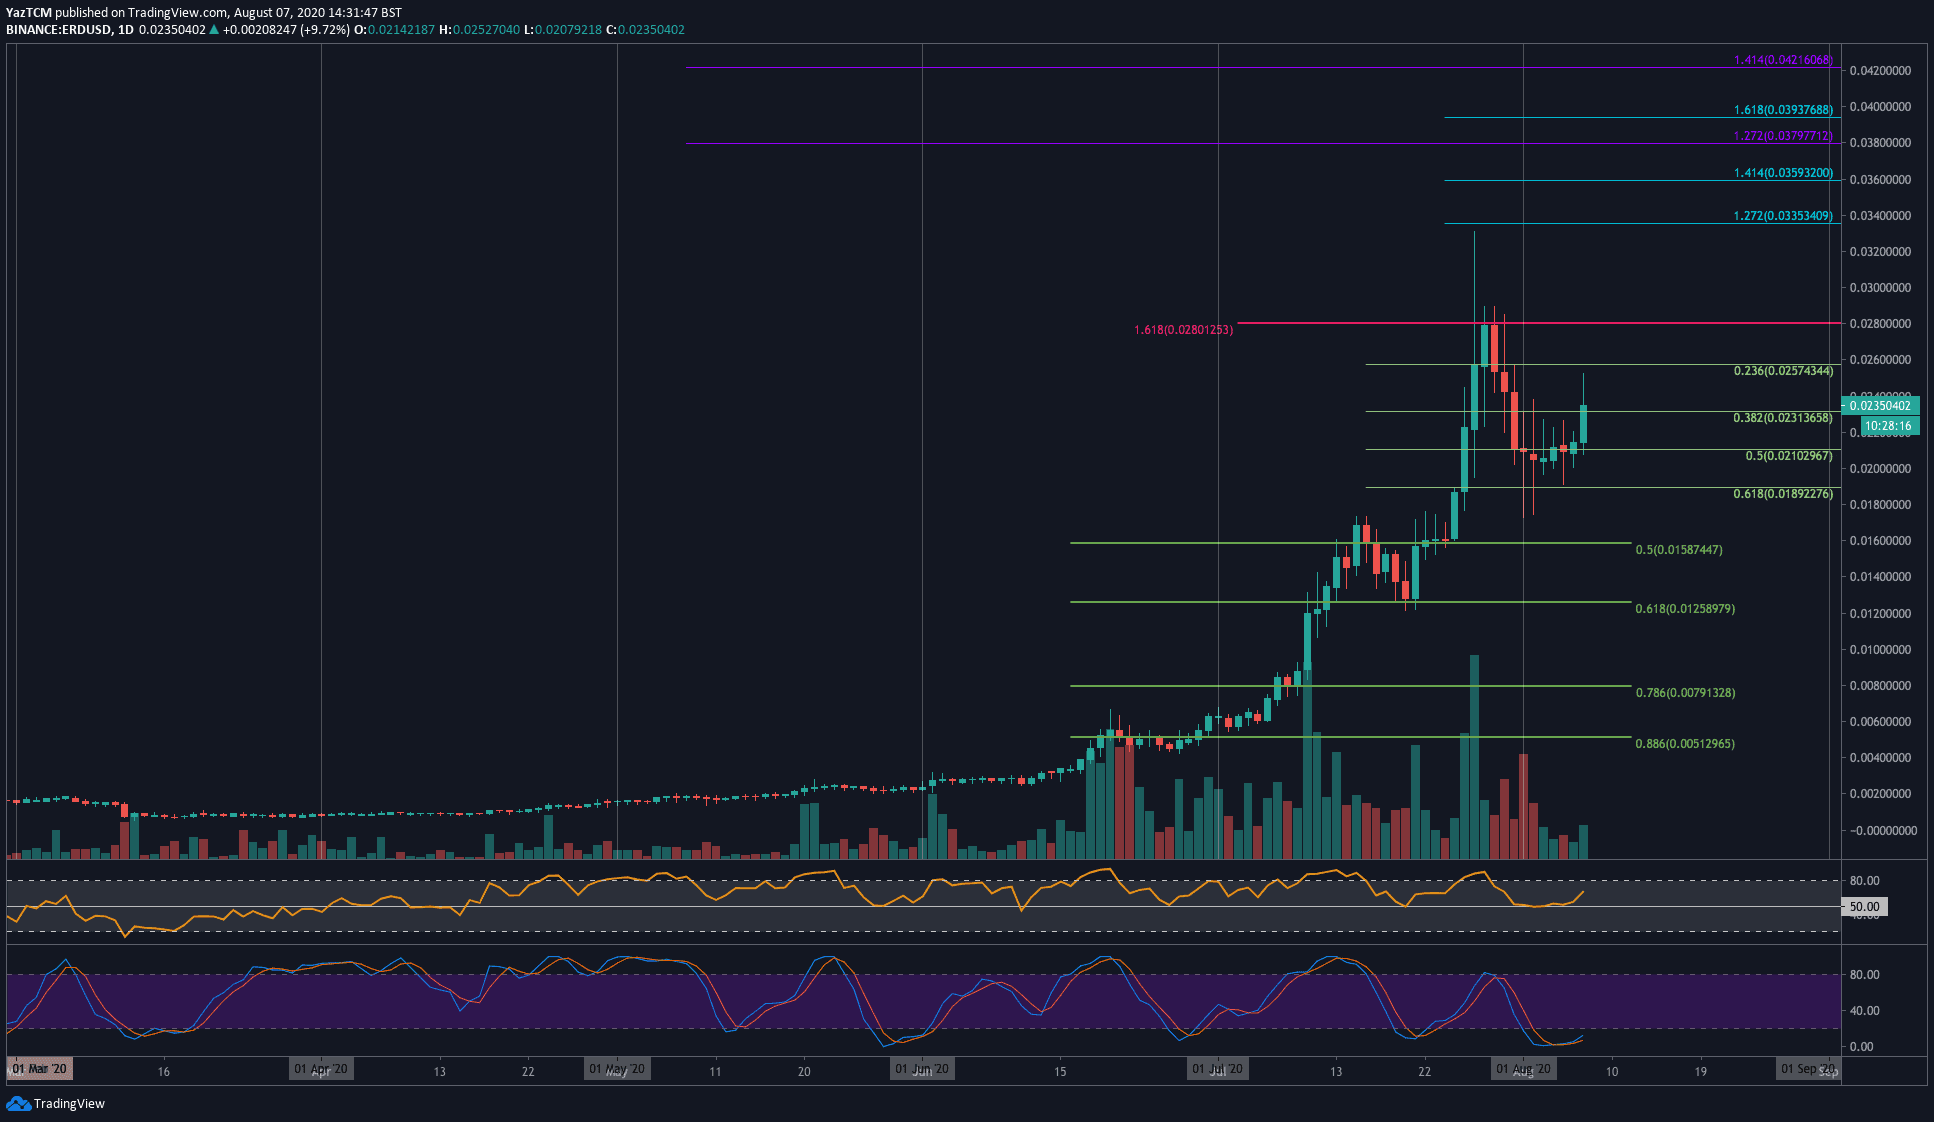
Elrond may have dropped a small 1.5% over the past 7-days, but it has increased by 11% over the past 24 hours. In fact, over the past month, ERD exploded by a total of 183%. The coin had surged in July to reach as high as $0.033. More specifically, it was unable to close above the resistance at $0.028 (1.618 Fib Extension), which caused it to roll over and close July at $00.21.
In August, ERD did spike lower into $0.018 initially, but it quickly bounced higher and is trading at $0.0235.
Looking ahead, the first level of strong resistance to overcome lies at $0.028. This is followed by resistance at $0.03. If the bulls continue above $0.03, resistance then lies at $0.0335 (1.272 Fib Exnteison) and $0.036 (1.414 Fib Extension).
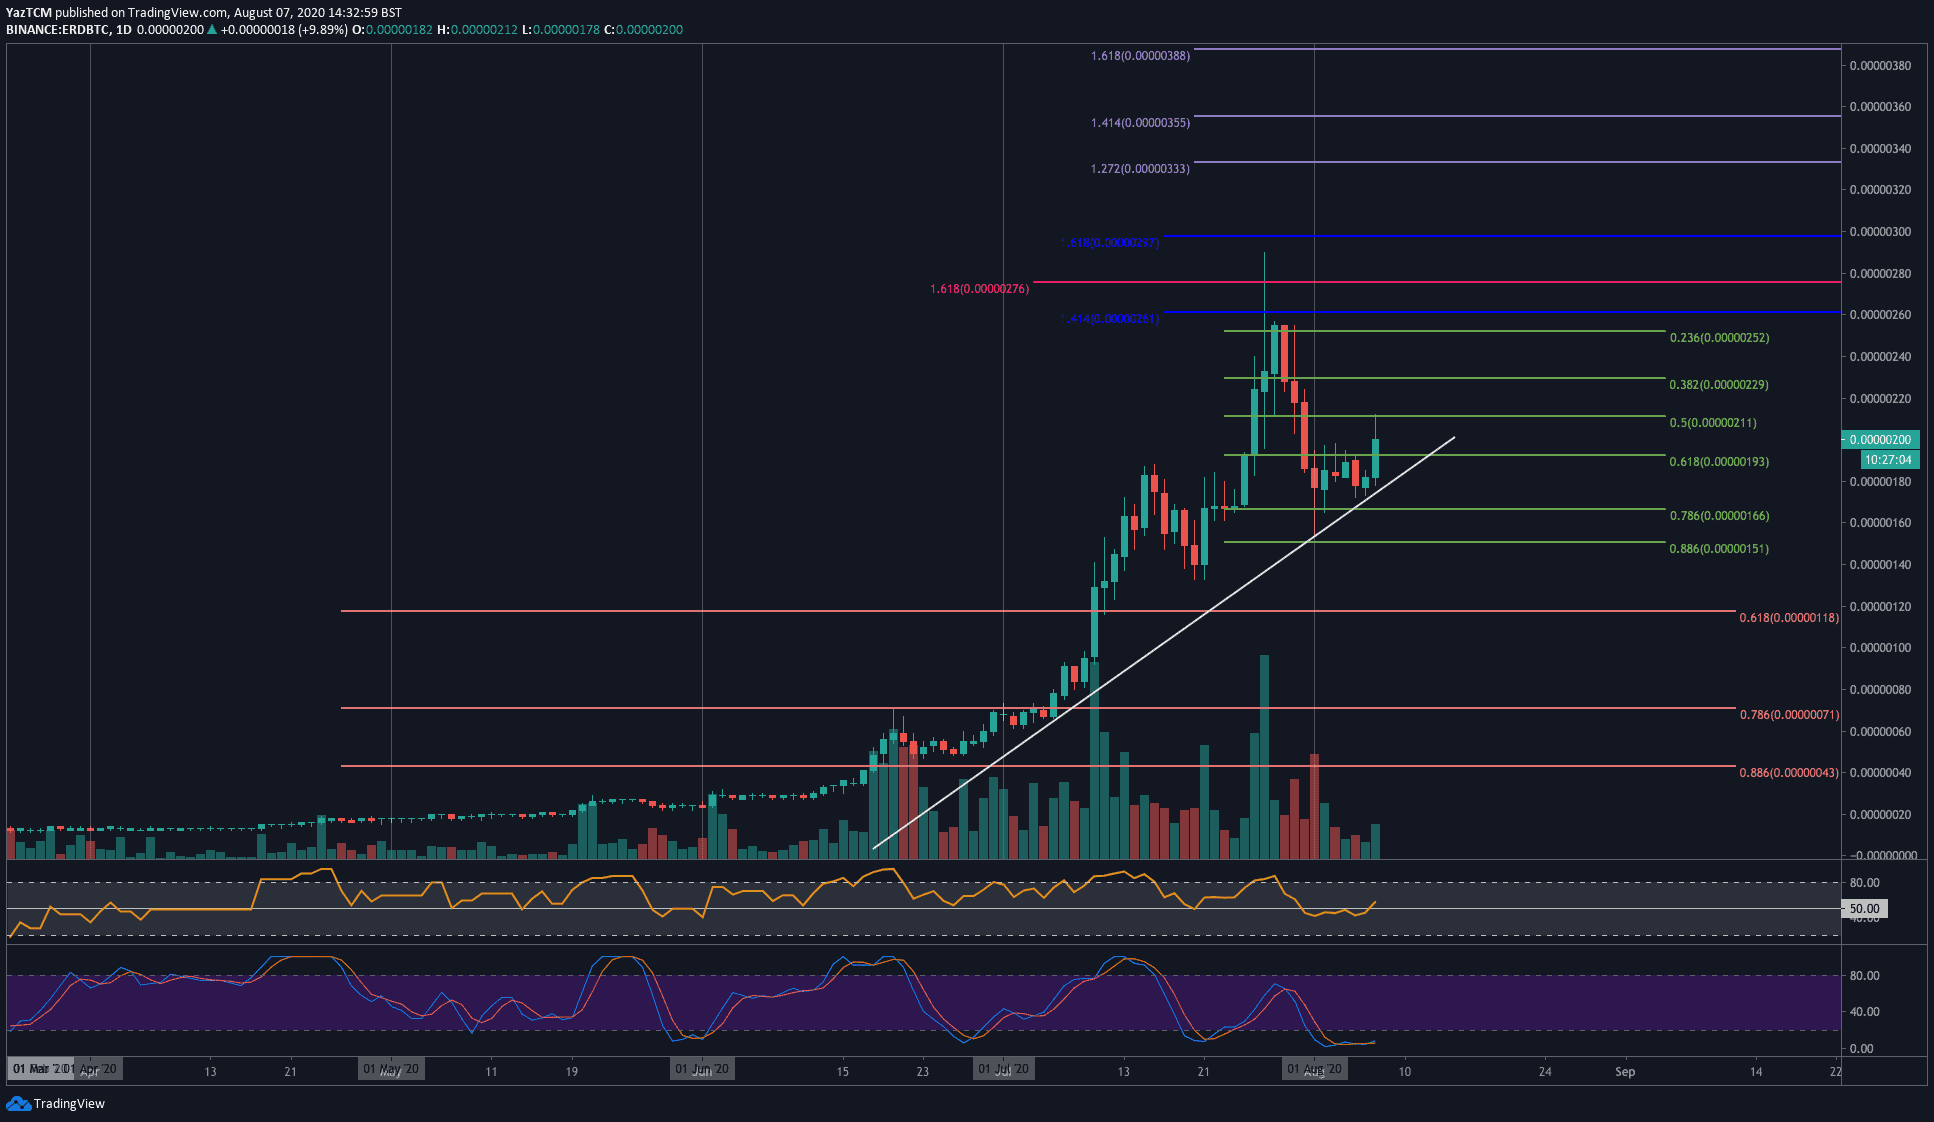
The situation for ERD against Bitcoin is very similar. The coin surged as high as 260 SAT toward the end of July and was unable to push higher. It then rolled over to reach the support at 151 SAT (.886 Fib Retracement) by the start of August.
During this past week, ERD rebounded from a rising trend line as it now trades at 200 SAT.
Looking ahead, if the buyers push higher resistance is located at 250 SAT, 261 SAT, and 276 SAT. Additional resistance lies at 300 SAT and 333 SAT.
On the other side, support is expected at 193 SAT (.618 Fib Retracement). This is followed by support at the rising trend line and then 166 SAT (..786 Fib Retracement).
Click here to start trading on BitMEX and receive 10% discount on fees for 6 months.
Disclaimer: Information found on CryptoPotato is those of writers quoted. It does not represent the opinions of CryptoPotato on whether to buy, sell, or hold any investments. You are advised to conduct your own research before making any investment decisions. Use provided information at your own risk. See Disclaimer for more information.
The post appeared first on CryptoPotato


