Disclaimer: The findings of the following article attempt to analyze the patterns emerging in the short-term Litecoin market and its impact on the crypto’s price
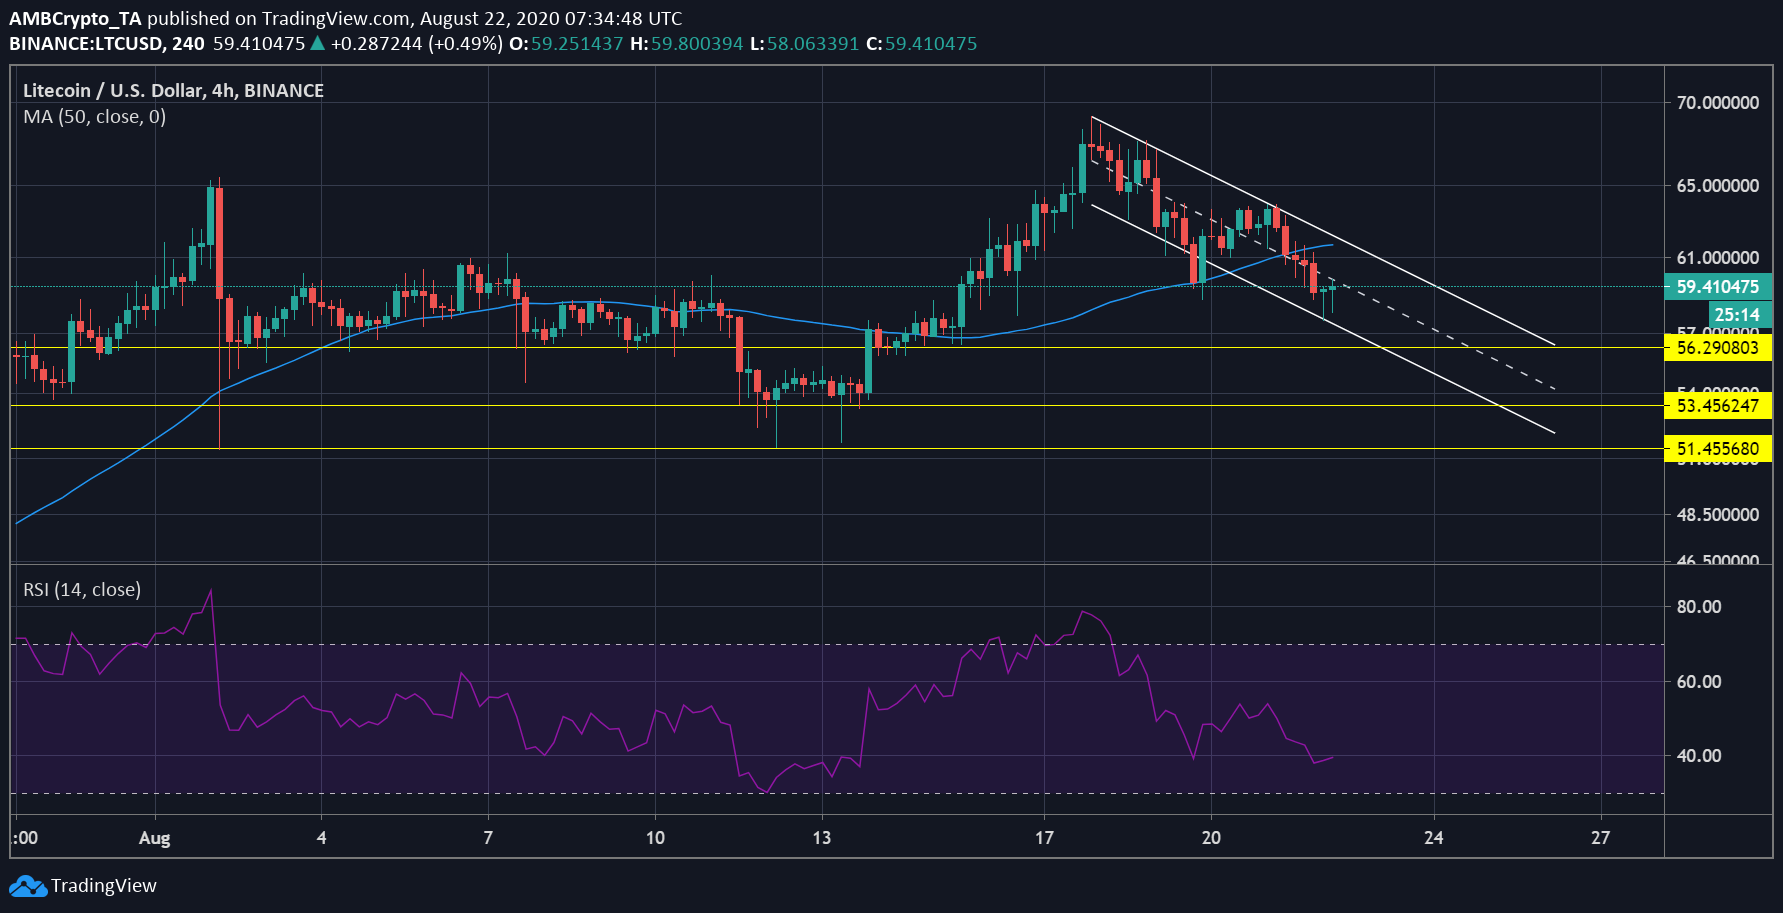
Litecoin’s price has been trending lower and lower on the charts, ever since it registered a surge between 13 and 17 August. In fact, LTC’s price peaked at $69.15 on 17 August, with the following candle underlining the beginning of a sell-off in the LTC market. Due to the aforementioned sell-off, Litecoin’s price tumbled from a peak of $69 to a value of $59.84, at press time.


Source: LTC/USD on TradingView
The attached chart highlighted the reversal in the bullish trend with the price of the digital asset trending lower. It formed a part of a descending channel, forming lower highs and lower lows. The price also noted an anomaly, one that contributed to a momentary surge in its value. However, with its next candle, the price had begun to dip again on the charts.
The 50 Moving Average also stressed on this reversal in trend. The 50 MA remained low as the price trended upwards and pronounced a bullish market. However, as the MA overtook the candles and aligned itself above the price candles, the trend reversal was confirmed.
The breach of this pattern could contribute to the price of Litecoin breaking down, especially since as per the Relative Strength Index, the coin was close to the oversold zone. Given the pressure in the market, such a breakdown could be imminent.


Source: LTC/USD on TradingView
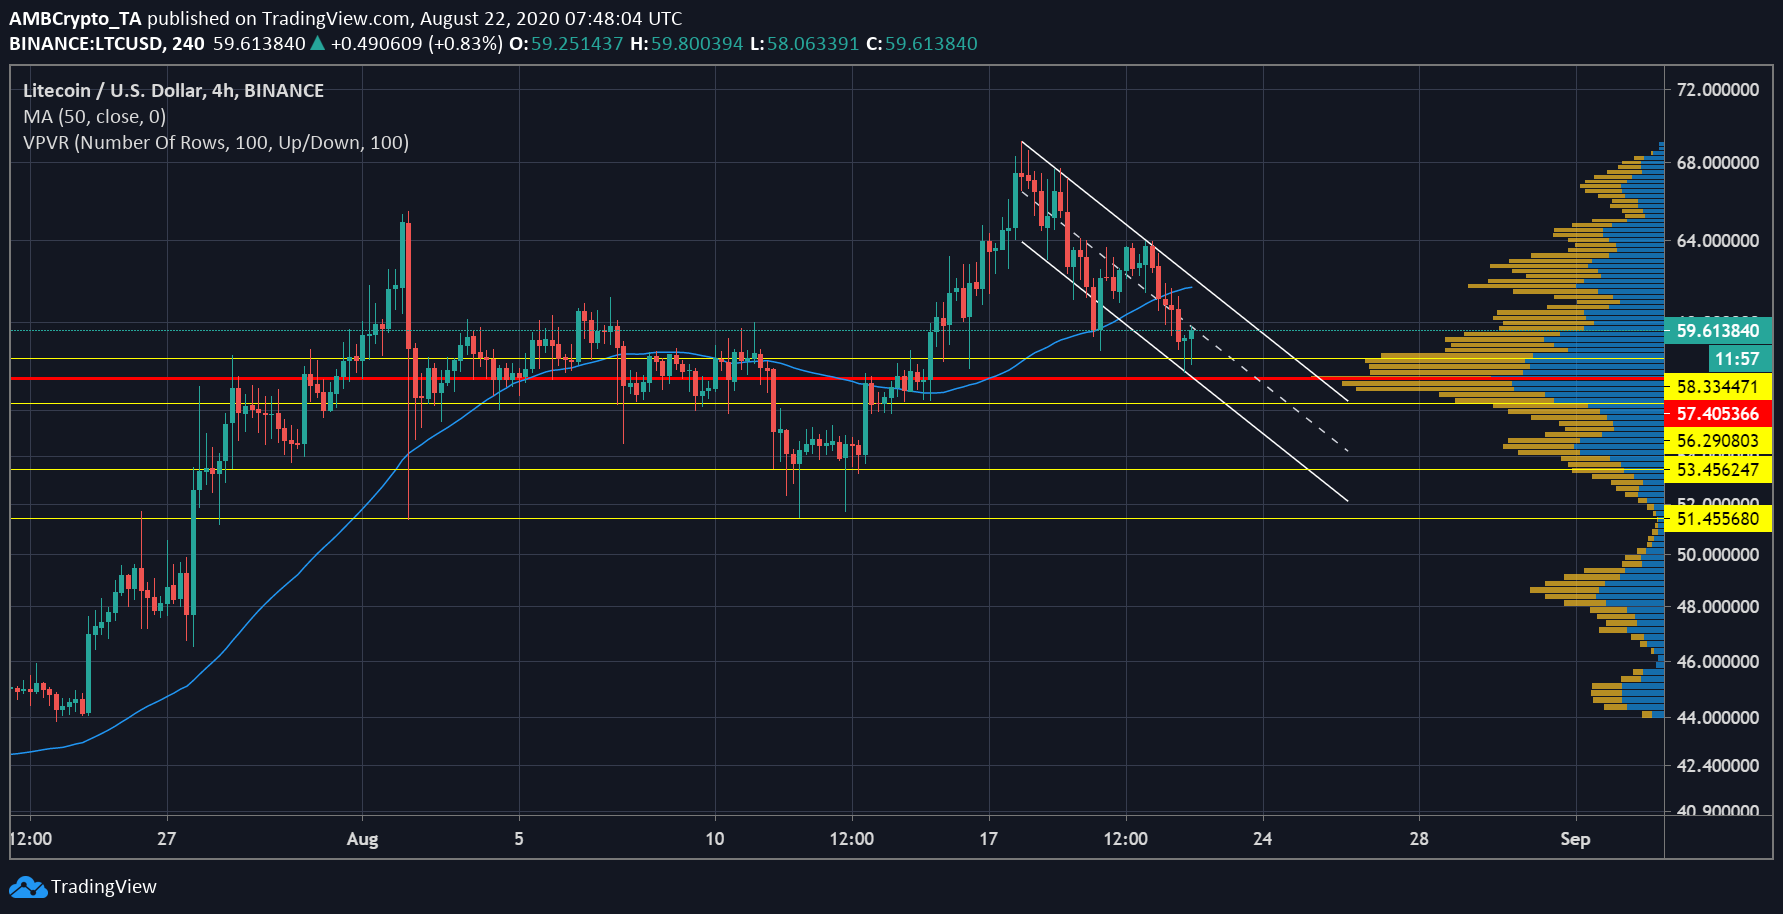
The Visible range noted the Point of Control at $57.40. As the digital silver stepped down the price ladder, there was a high trading range noted right above the PoC at $58.33, wherein the price of LTC could register significant trading activity. However, if the price of the crypto-asset were to slip under $57.40, it may find support at $56.29. If the price breaks down from the descending channel, the selling pressure may further push the price of LTC to $53.45. However, this point has not been tested enough.
Market behavior at this point of time may determine the future movement of the coin. However, a breach of the channel may lead to LTC slipping to $58, which was a support level, with a move under the PoC likely to result in higher losses.
The post appeared first on AMBCrypto


