Disclaimer: The findings of the following article should not be taken as investment advice as it is the sole opinion of the writer
Clocking in at a low of $9,980 on the morning of 9 September, Bitcoin soon recovered by close to $600 in a matter of just 24 hours. However, despite the sudden bullishness, its immediate resistance level of $10,440 was still too much for Bitcoin to breach. Having failed to cross $10,440, the crypto-asset was observed to be depreciating over the past few hours, sustaining another period of correction. Bitcoin was valued at $10,256, at press time, with a market capitalization of $189 billion.
Bitcoin 1-hour chart
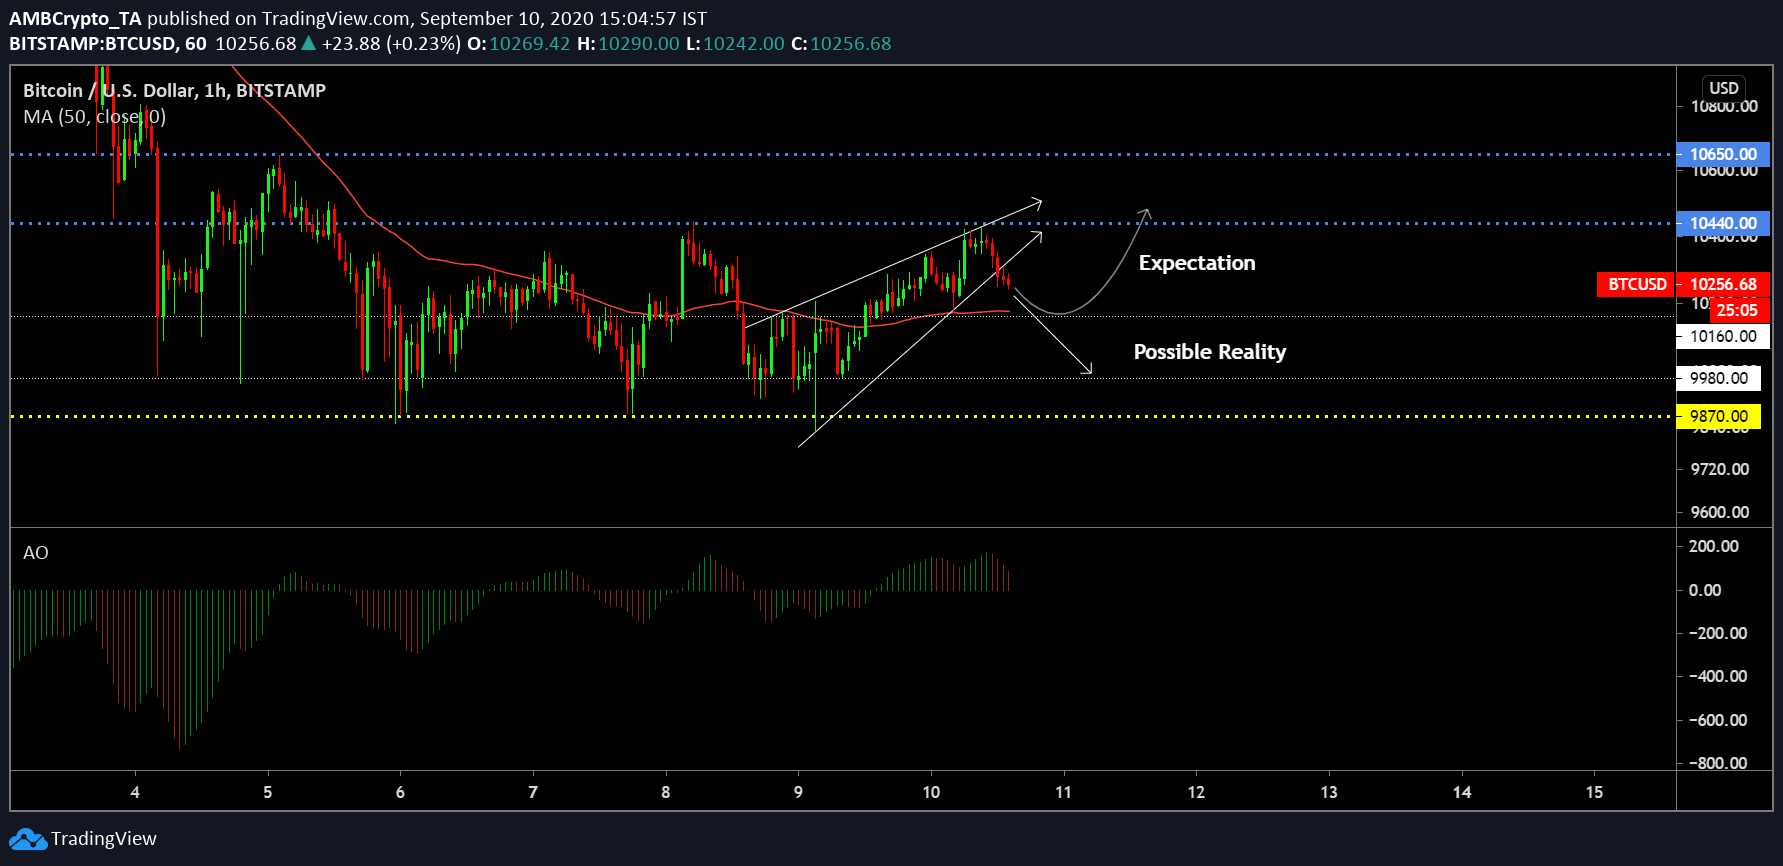
The 1-hour chart for Bitcoin clearly highlighted the rising wedge pattern which led Bitcoin to test the resistance at $10,440 again over the past 12-hours. However, after having undergone a bearish breakout from the pattern, Bitcoin’s price, at the time of writing, was sliding down again, on its way to test the immediate support at $10,160.
In order to retain some of the bullish momentum, Bitcoin could possibly re-test $10,160 since the 50-Moving Average was also acting as underlying support at that range. In spite of that, it is important to note that the market was in overwhelmingly bearish territory, at press time, therefore, one scenario might see Bitcoin drop down to $9,980.
Further, the Awesome Oscillator also pointed to a decrease in temporary bullish momentum, suggesting that the bears were coming back to the market.
Bitcoin 30-min chart


Source: BTC/USD on TradingView
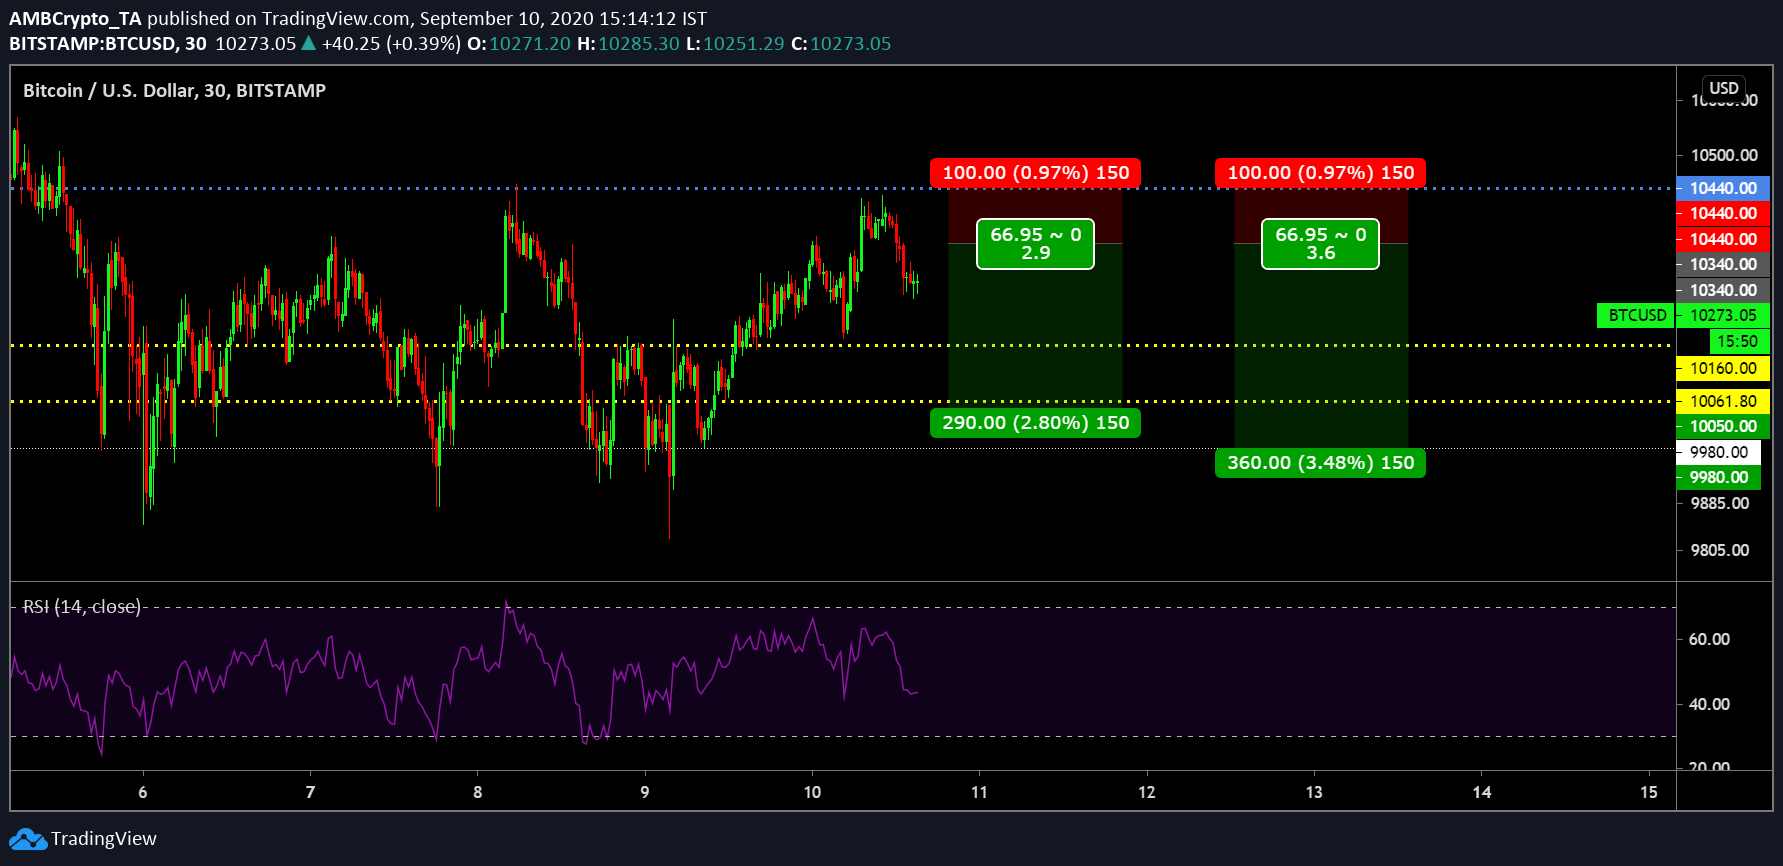
With market indicators and price movements hinting at a price collapse, a couple of short positions seemed to be reasonable, both differing in terms of Risk/Reward Ratio. The entry for both the assets can be placed at $10,340, accounting for a little bit of retracement. An exit point or stop loss should be placed at the immediate resistance of $10,440, and if the trend were to go south, take-profits can be placed at supports $10,050 and $9,980.
A take-profit at $10,050 suggests a Risk/Reward ratio of 2.9x, whereas profits if taken at $9,980 will note an R/R ratio of 3.6x.
With the Relative Strength Index or RSI leaning towards an upward curve, a bit of recovery needs to be accounted for too.
The post appeared first on AMBCrypto


