Disclaimer: The findings of the following article attempt to analyze the emerging patterns in Bitcoin Cash’s long-term market and their impact on its price
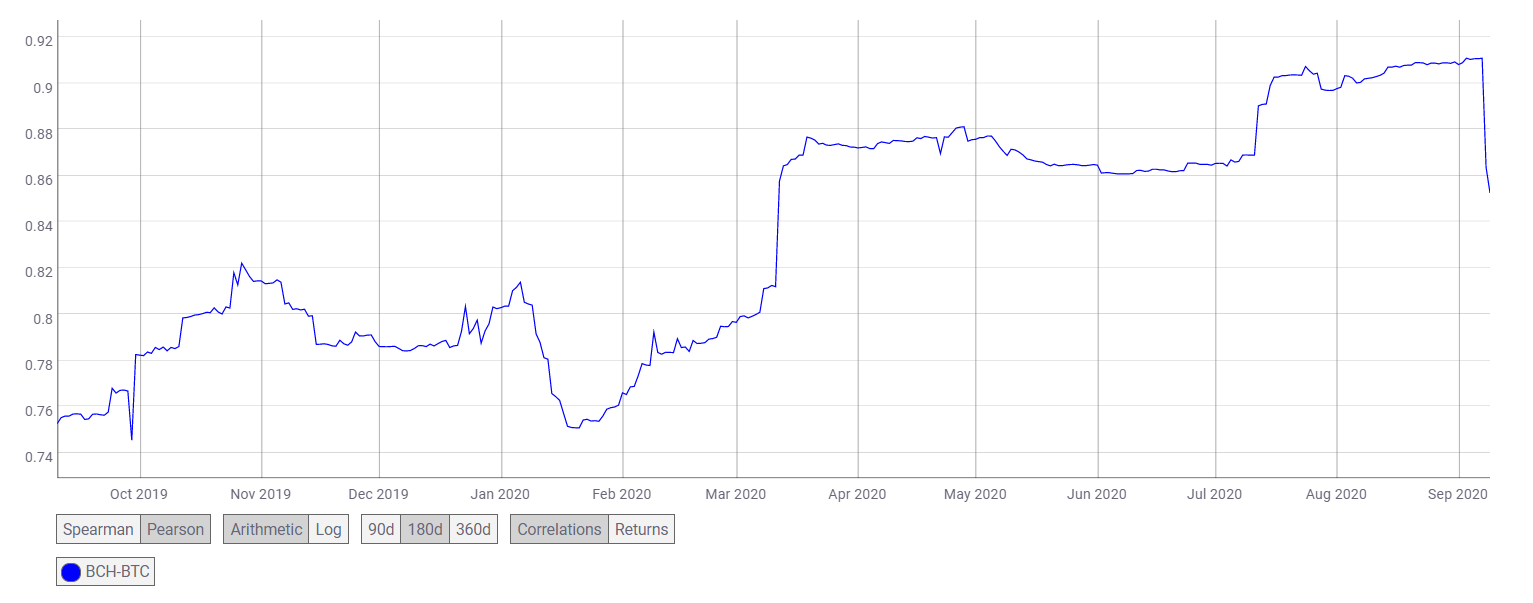
The popular fork of Bitcoin, Bitcoin Cash was following BTC’s lead as the market registered many great troughs and peaks recently. However, the latest corrections in the market have shaken the correlation shared between Bitcoin and Bitcoin Cash. The two digital assets’ correlation had noted a great spike when the crypto-market collapsed in March. However, when the market dipped in September, this correlation sunk too.
The attached chart highlighted the steep fall in the Pearson correlation coefficient, with the same dipping from 0.9106 on 7 September to 0.85247 on 9 September. In fact, the BTC-BCH correlation had not dipped under 0.86 since the aforementioned spike back in March.
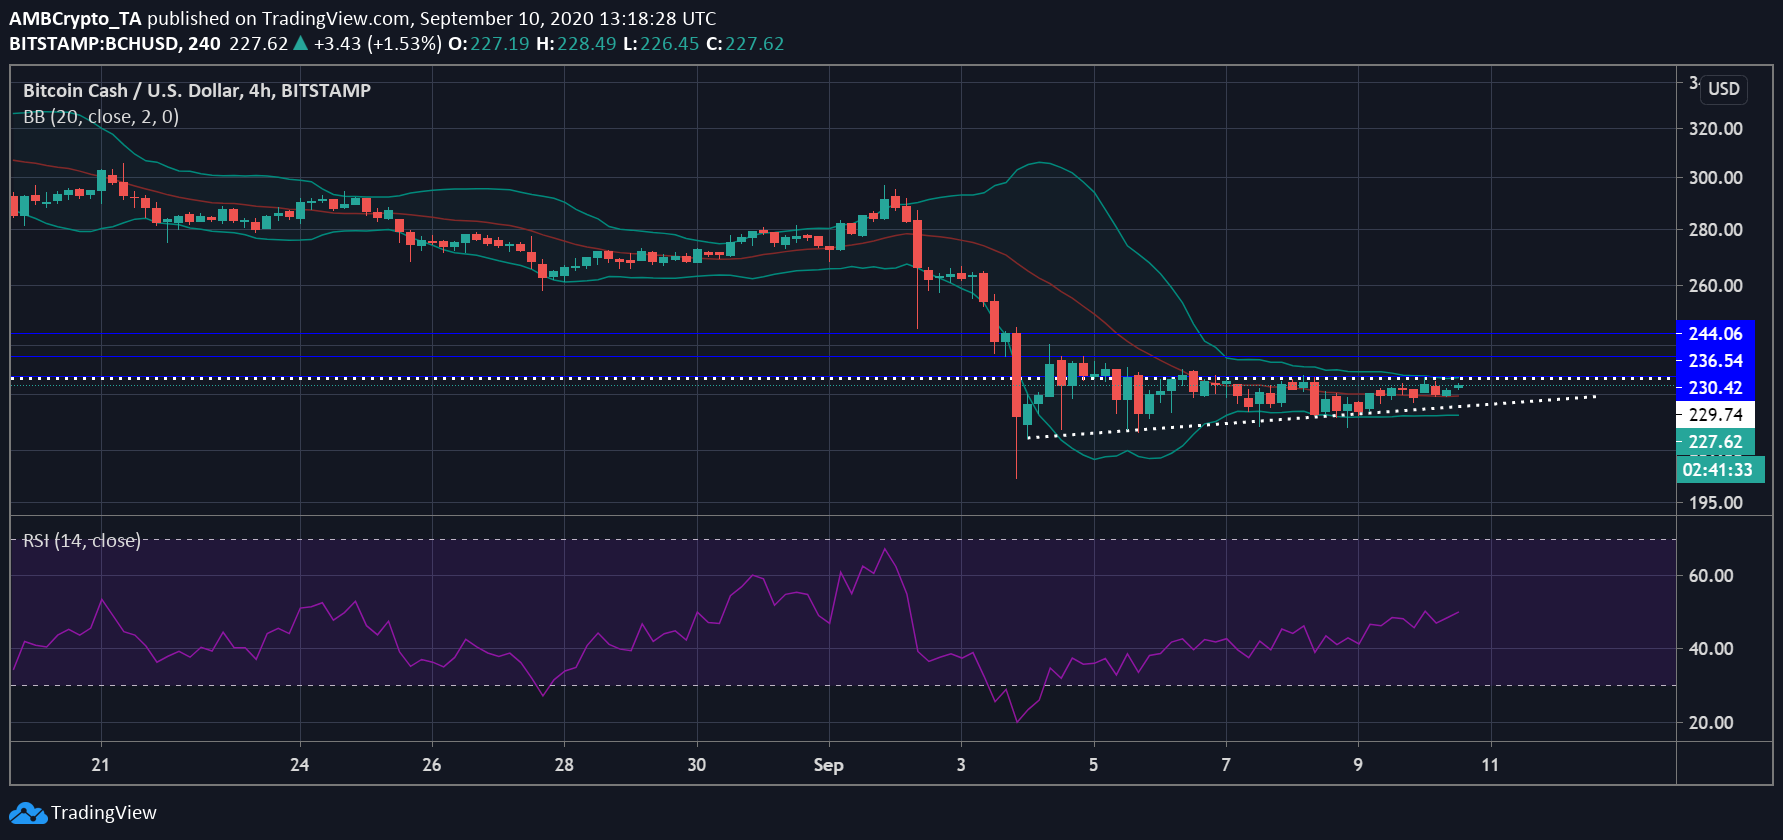
With Bitcoin Cash’s correlation with Bitcoin falling, its spot price has also struggled, with BCH trading at $227.27, at press time. The press time trading price was hovering close to BCH’s resistance level at $230. However, the cryptocurrency’s recent price movements had given rise to a bullish pattern on the charts, one that pointed to a breakout soon.

Source: BCH/USD on TradingView
As the price of BCH started consolidating, $230.42 acted as the immediate resistance, forming the base of an ascending triangle being formed. The wicks closed higher and have been connected by a line forming the ascending triangle. This pattern was a sign of accumulation for the BCH market.
Looking at the crypto’s indicators, a bullish change in trend can be inferred. The Bollinger Bands converged on the charts after a degree of volatility had swept the market in early-September, whereas the Signal line shifted under the price bars to point to a change in price trend. Similarly, the Relative Strength Index rose from the oversold zone, with the same observed to be in a zone of equilibrium, at the time of writing.

Source: BCH/USD on TradingView
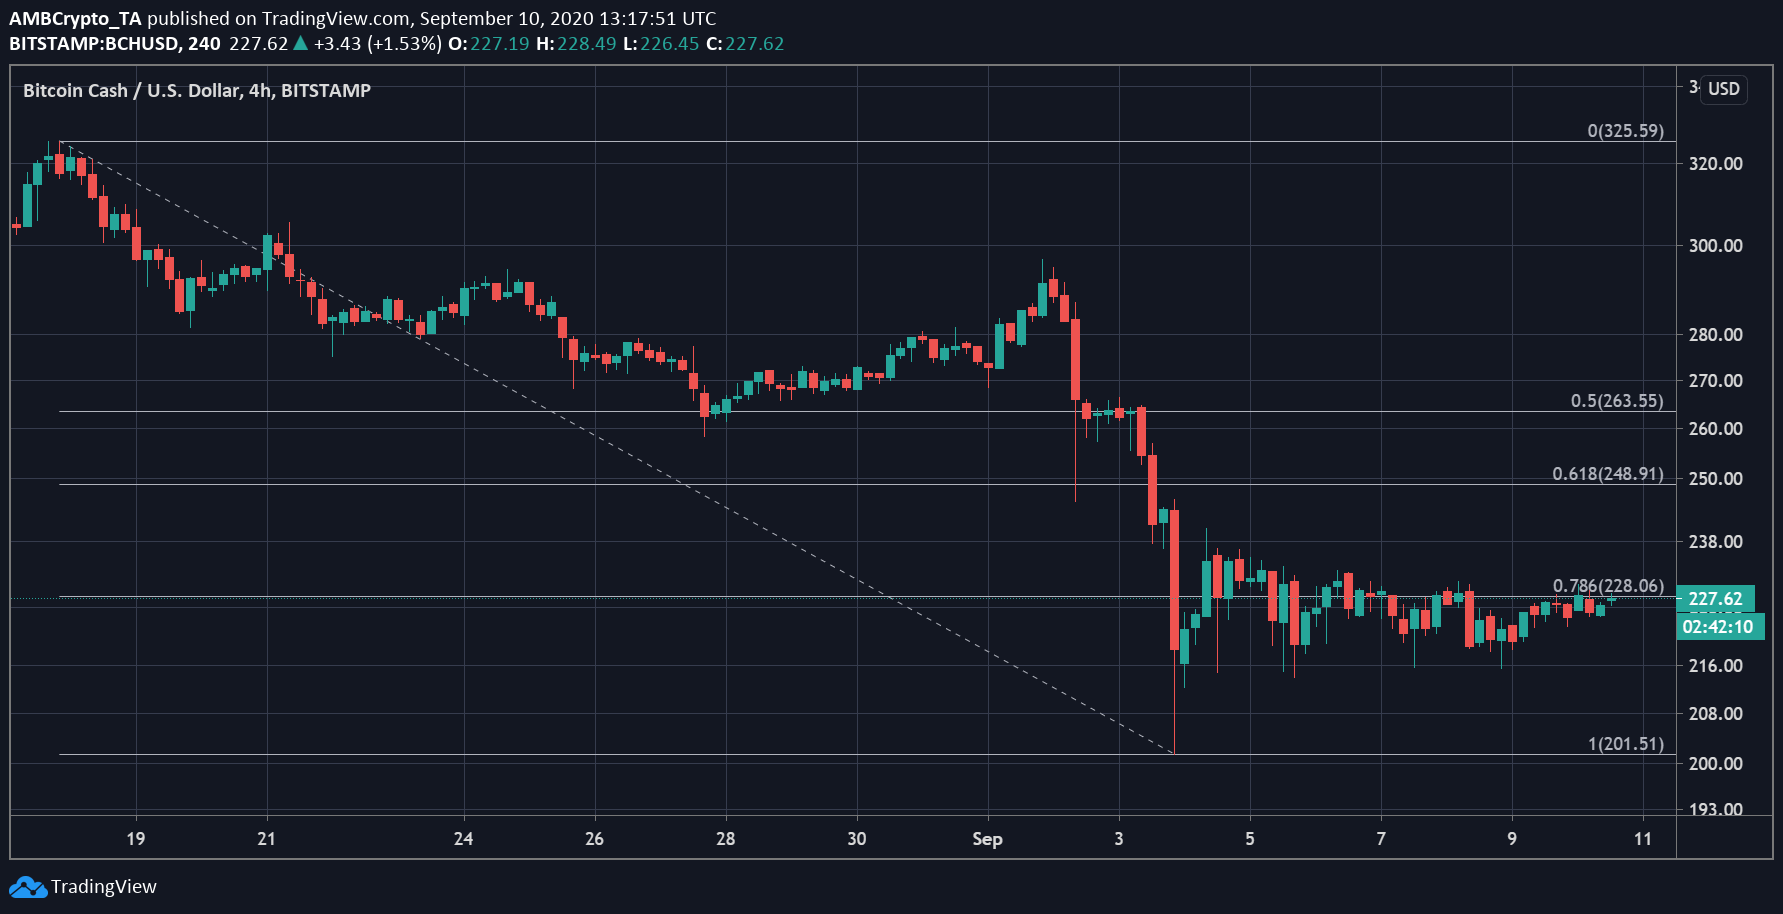
With BCH preparing for a breakout, the Fib retracement tool marked important resistance levels over the given period. The cryptocurrency would need to push past $228 to have any chances of a successful breakout. Given the sudden depreciation in the value of the coin, the next resistance was marked at $248.91, a level that would mean an 8% hike in BCH’s press time price. To reach its pre-crash price, BCH may require more time as crucial price levels have been marked between $228 and $300.
The post appeared first on AMBCrypto

