More than a decade into its existence, Bitcoin is finally maturing into a full-blown stock market hedge.
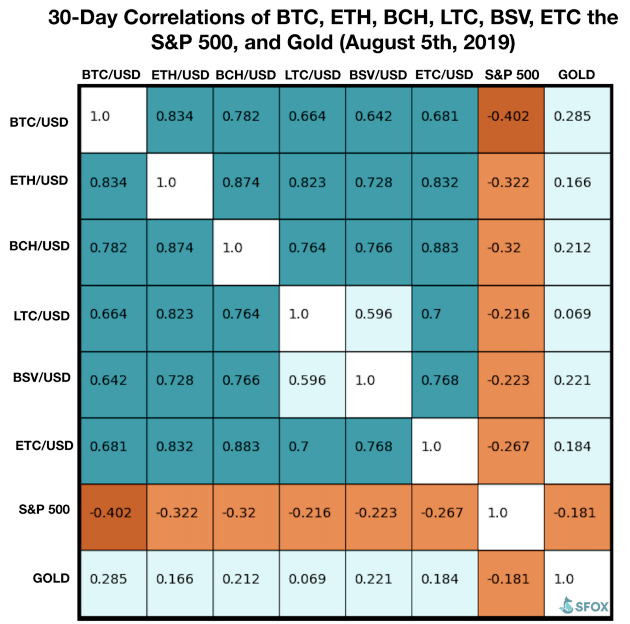
That’s the conclusion of new research from crypto prime dealer SFOX, which indicates that Bitcoin and other major cryptocurrencies like Ethereum have developed a negative correlation with the S&P 500. This means that as the stock market bellwether index falls, the prices of the cryptocurrencies rise – and vice versa.
Over the past 30 days, Bitcoin’s correlation with the S&P 500 was -0.402, while Ethereum’s correlation with the stock market index was -0.322. The index’s correlation between Bitcoin Cash, Litecoin, Ethereum Classic, and Bitcoin SV was -0.32, -0.216, -0.267 and -0.223 respectively.

The negative correlation between the S&P 500 and cryptocurrencies had also been observed in May when Bitcoin pierced above $6,000 for the first time in eight months.
Bitcoin to the rescue
According to SFOX, this phenomenon was attributable to the cryptoassets being increasingly viewed as offering a safe-haven in times of global turmoil. While they have not replaced gold as a mainstream hedge, cryptocurrencies were more negatively correlated to the S&P 500 relative to the yellow metal. Gold’s correlation to the stock market index was -0.181.
The trade war between the U.S. and China, which has the potential of slowing economic growth across the world, is one possible catalyst for the growing safe-haven status of crypto, especially Bitcoin:
“Data have suggested for months that investors may be using bitcoin as a hedge against global markets; with many uncertain about the impact of rising tariffs and global currency instability on the market, it may be the case that traders are equally unsure of crypto’s future.”
Proof of safe-haven
This week, the negative correlation between Bitcoin and the stock market was on full display.
This is playing out perfectly. Gold and Bitcoin up as markets tumble. Yesterday equities recovered and BTC pulled back. Bitcoin is being accepted new safe haven.
It’s a matter of time befor it replaces gold. pic.twitter.com/qCojZJsgvR
— Ran Neuner (@cryptomanran) August 7, 2019
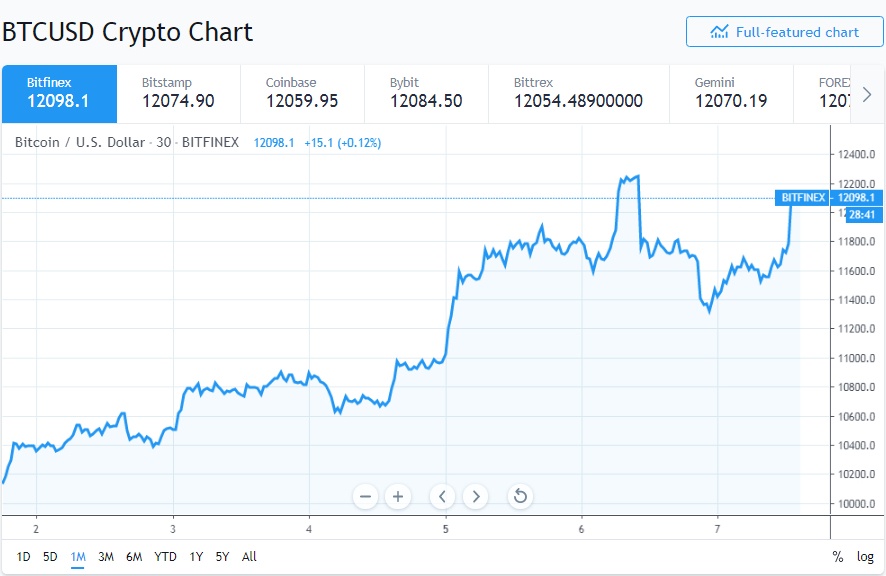
On August 5, when the Dow Jones Industrial Average fell by close to 800 points, BTC surged from under $11,000 to over $12,000. Meanwhile, the S&P 500 also fell by nearly 3%.
There was a reversal of fortunes on Tuesday when the U.S. stock market indices recovered some of their Monday losses while Bitcoin tumbled from a three-week high of about $12,300 to under $11,200.
Today, as the Dow and S&P 500 each shed over 1%, Bitcoin climbed back above $12,000, an appreciation of over 7% from the day’s low.

By press time, though, BTC had fallen back toward $11,700 – and the S&P 500 had trimmed its losses.
Click here for a real-time Bitcoin price chart.
The post appeared first on CCN


