Volatility is a given in the Bitcoin market, but nowadays, it’s a given in every market. Let’s face it – 2020 hasn’t been a good year for a lot of things, least of all the financial markets. With stock markets hitting record-lows, inflation only likely to rise from here, and investors puzzled with all that’s happening, the volatility of 2020 has not helped anyone. However, what it has shown is that volatility is not just a facet of the crypto-markets, but every market out there.
Bitcoin began the year at $7,200, dropped to a low of $3,800, jumped to a high of $12,200, and is now just over $10,000. It’s safe to say that the crypto-market has been a roller coaster. But, using a word like “volatile” or “bullish” to paint over the current year’s market with a broad brush doesn’t seem right, so let’s look at it a bit more strategically. How has the Bitcoin market fared in 2020?
With the highs and lows established, let’s look at the middle. On average, Bitcoin has traded with a price of just above $9,000, $9,060 to be precise. Spending the vast majority of that time under the average at the beginning of the year and a vast majority of it over the average since the halving in May. In terms of the day-count, 58.7 percent of the days in 2020 was spent above the average and 41.3 below it between the beginning of the year and just after the drop from $12,000 to $10,000 at the beginning of the current month.
Out of the 237 days within the period, 145 were in the green above the average and 102 below it.

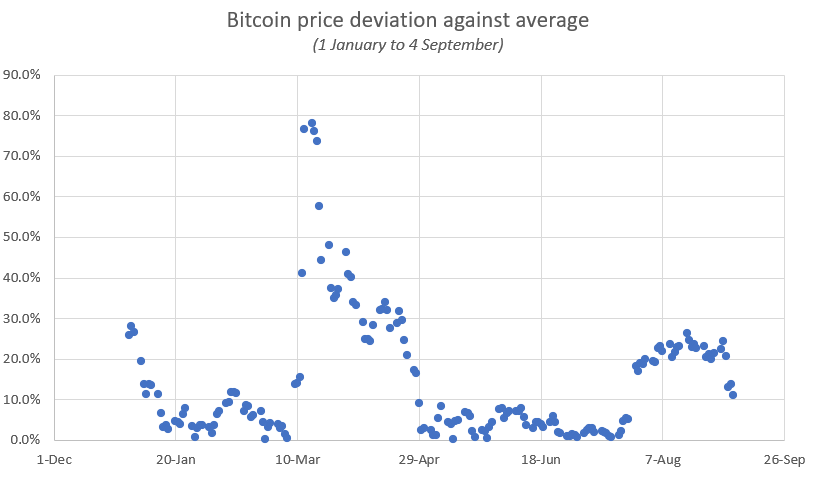
Looking at the deviation of the trading price against this fixed (and not moving) average, there was an average deviation of around $1,800 or 14.4 percent against the daily trading price of Bitcoin within the period range. Given above is the deviation of the daily price against the average of $9,064. The highest deviations were unsurprisingly in March, a month when the price crashed to below $4,000 and recovered over the next two months. There is a heavy concentration of deviation under 10 percent for April to June as the price traded sideways followed by a jump up over $10,000 in July.
All in all, a daily price deviation of below 10 percent against the average occurred for 137 days or 55.3 percent of the days within the period. The deviation between 10 percent to 25 percent occurred for 68 days, or 27.4 percent of the period, between 25 percent to 50 percent for 36 days or 14.5 percent, and over 50 percent for 7 days or 2.8 percent of the period.
Putting this in context of the current price emphasizes that the “bullish” swing we’re seeing is at least $1,200 over Bitcoin’s yearly average and it’s been this way for over two months now.


Source: Coinstats
The post appeared first on AMBCrypto


