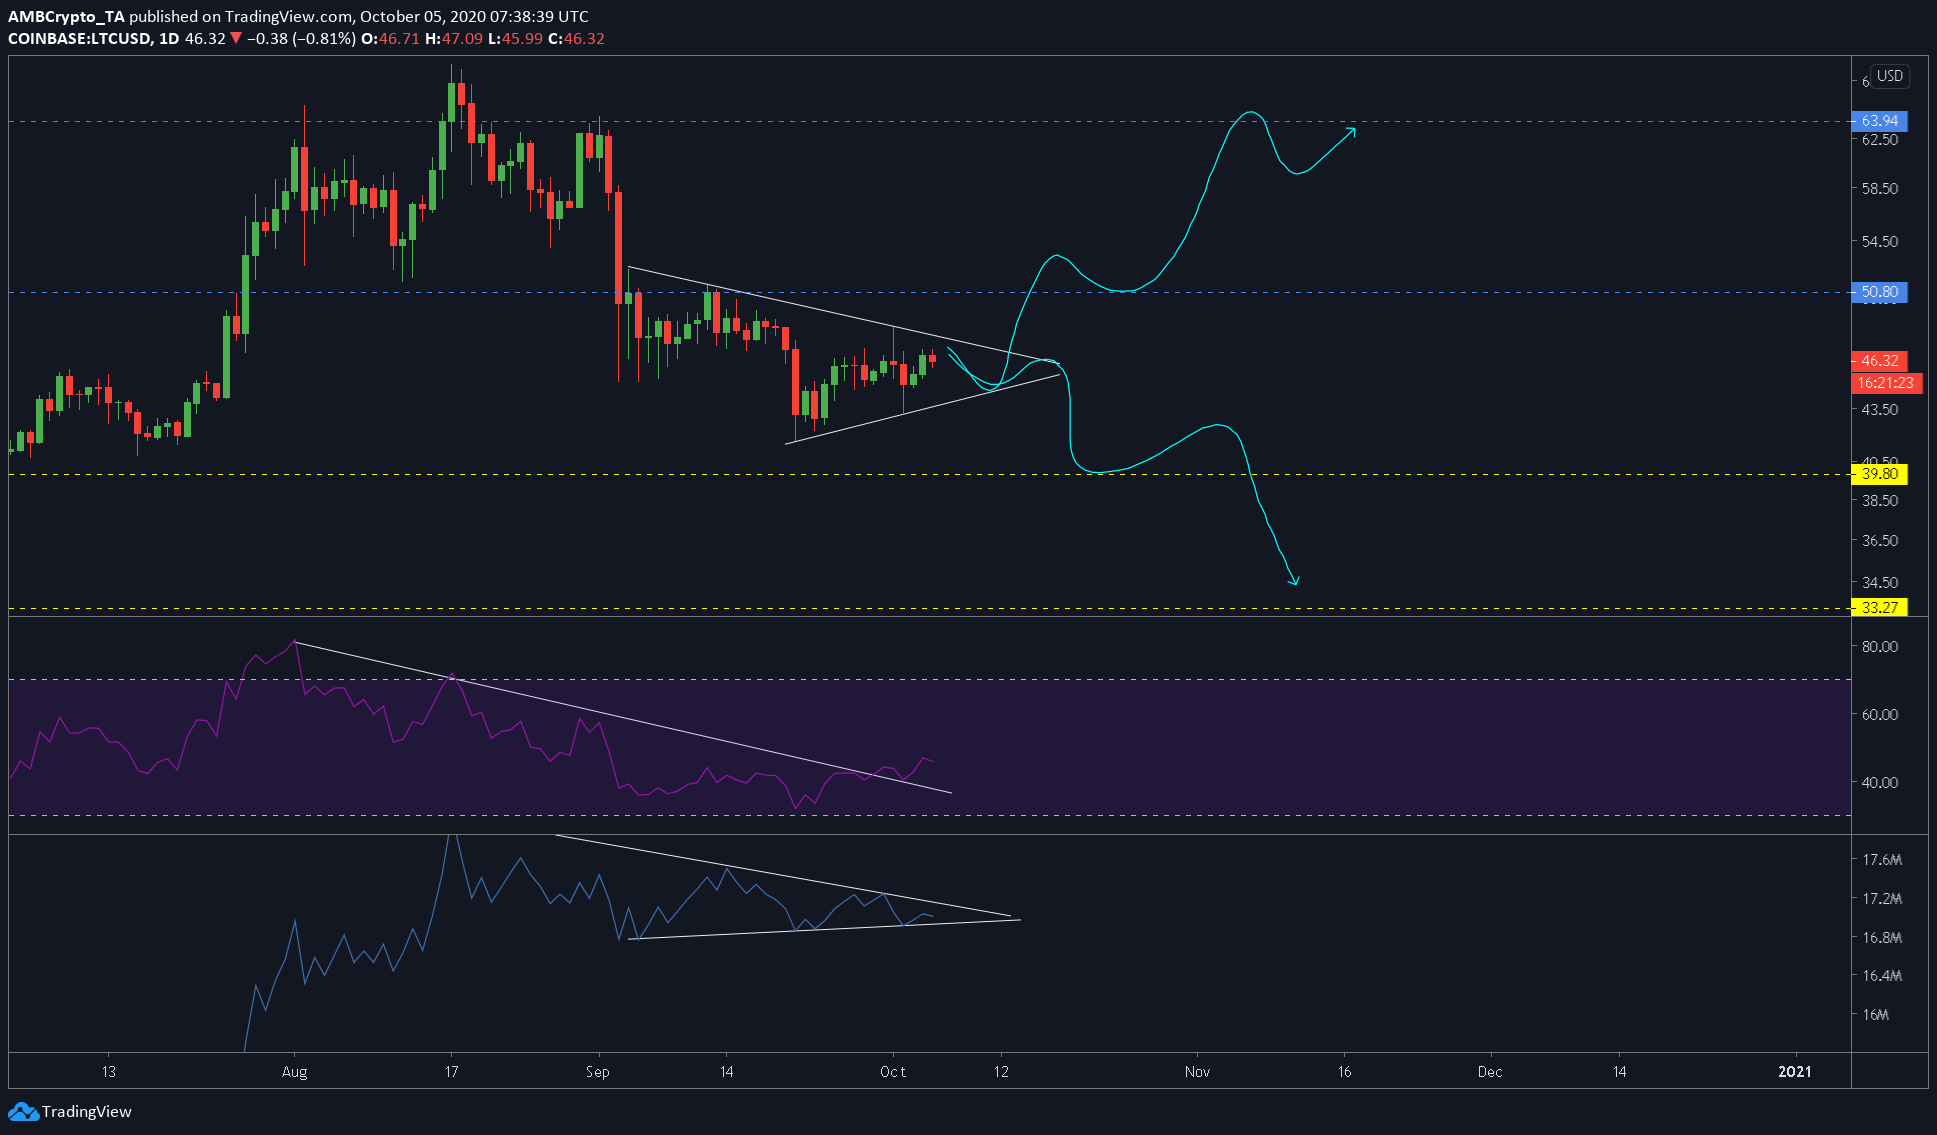
Litecoin has seen a fair amount of surges in the past week or so, however, these profits were wiped off equally quickly. At press time, LTC is trading at $46.37 and presents an ambiguous situation about its near future.
Litecoin 1-day chart


Source: LTCUSD TradingView
The 1-day chart attached above showed Litecoin forming a symmetrical triangle after a sudden drop witnessed on September 1 and 2. Since it is a symmetrical triangle, the breakout could go either way, hence, taking a look at indicators might help discern the breakout direction.
There are two possible scenarios, bullish and bearish.
The bullish scenario would mean for LTC to conquer the resistance at $50.80 which is around a 9.27% surge from the current price. Breaching this, the price might undergo sideways movement at the $50-level.
If bitcoin and the crypto ecosystem gets taken over by bulls, then we can expect LTC to head to $63, which is 38% from the current level.
The relative strength index, at press time, has broken out of its downtrend and is heading higher, which indicates the bulls are incoming.
The bearish scenario for litecoin would be for the price to head lower from its current price level. The supporting scenario for this is the prior trend, which together with the symmetrical triangle forms a bearish continuation pattern aka bearish pennant.
The bearish target for this scenario is $39.80, which is 13% from the current level. The other bearish target for this is a grim one and would mean for the price to head as low as $33, which is 27% from the current level.
The OBV indicator, like the price, is consolidating and a confirmation to either side would be finalized after it breaks out of the pattern. However, looking at the price data for the last 2 weeks, the price has been constantly going higher. This is in addition to the higher low being formed on September 21.
The post appeared first on AMBCrypto


