ETH/USD – Short-Term Consolidation Continues
Key Support Levels: $336, $324, $317.
Key Resistance Levels: $342, $365, $378
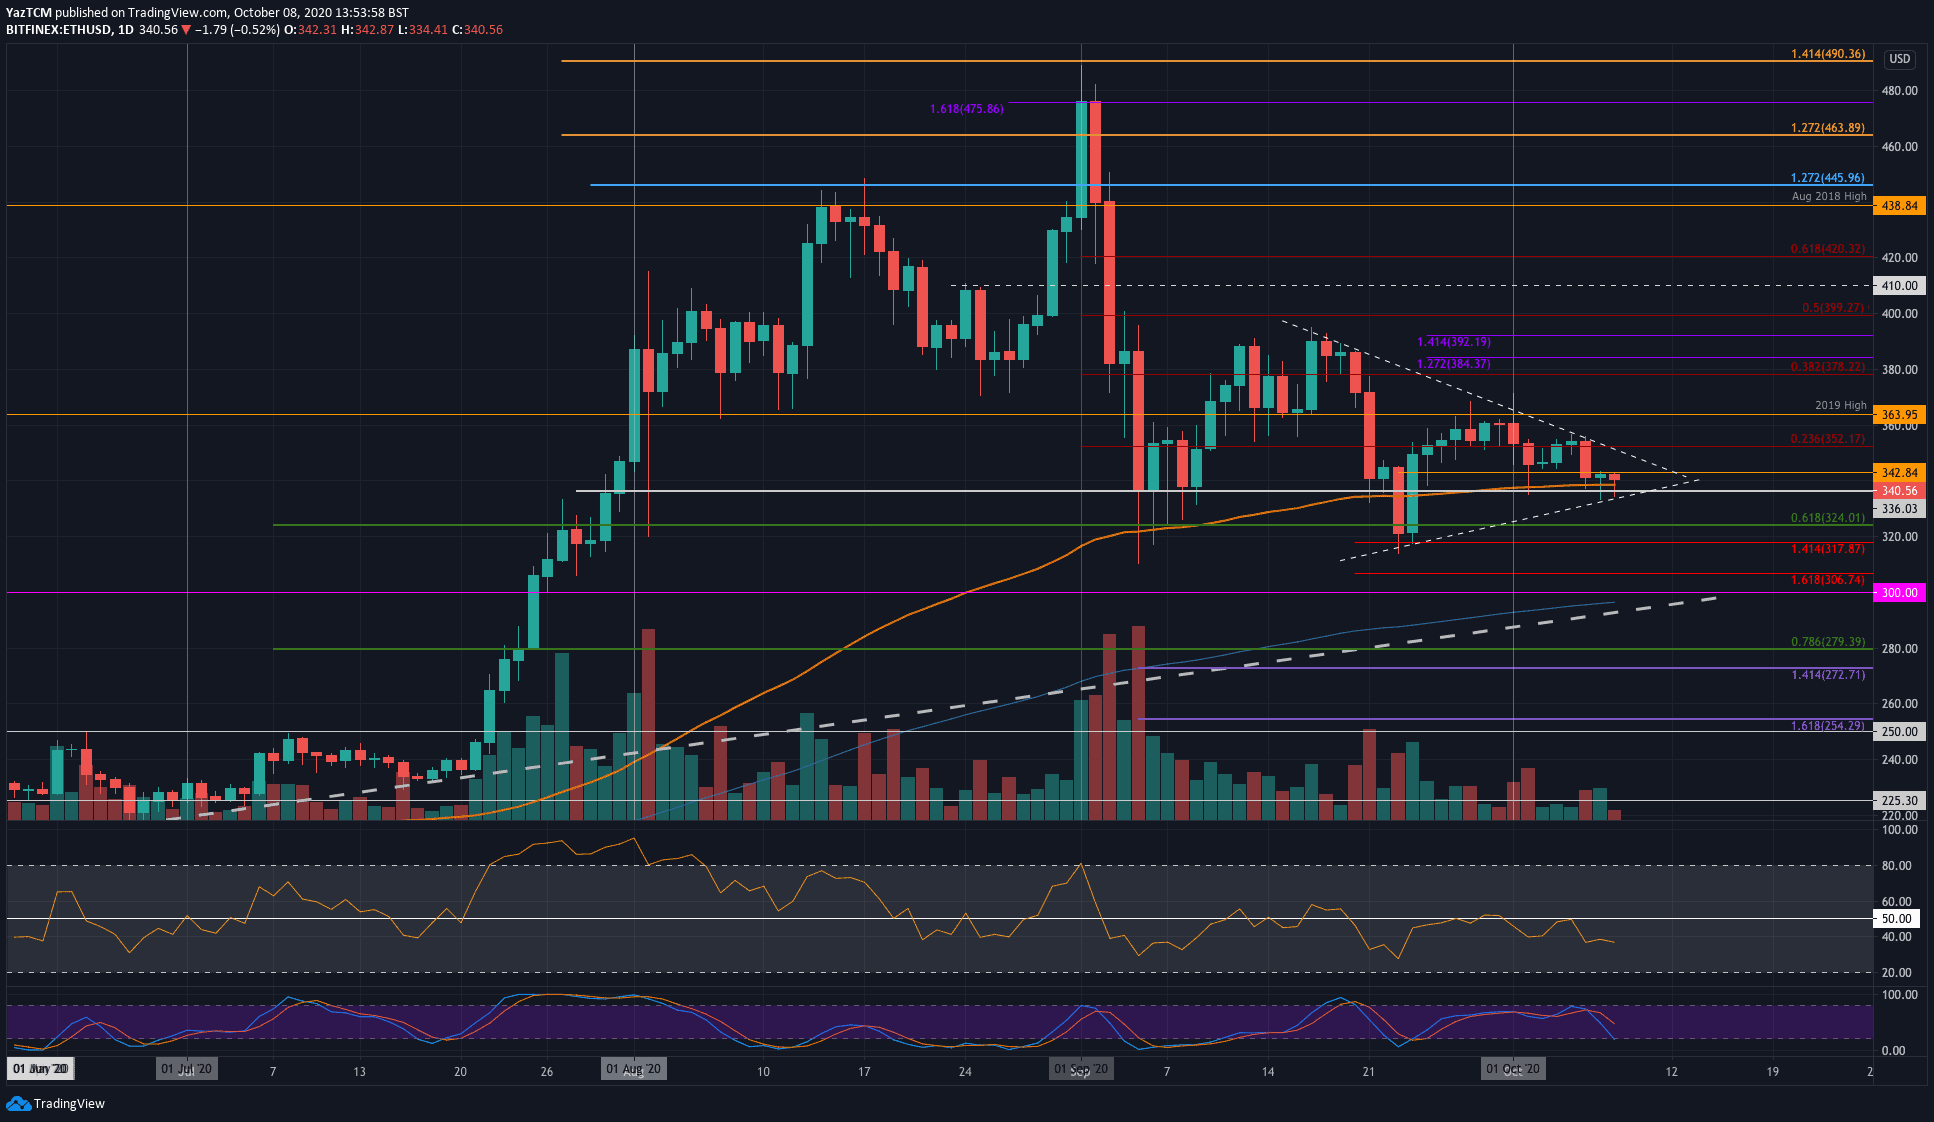
Ethereum has been trapped in a short-term symmetrical triangle pattern since mid-September. The coin failed to break above the upper boundary on Tuesday as it headed lower into the 100-days EMA. The support there has held over the past two days after ETH rebounded from the lower boundary of the triangle.
The coin is now quickly approaching the apex of this consolidation – where a breakout is expected.

ETH-USD Short Term Price Prediction
If ETH closes a daily candle beneath the 100-days EMA and falls beneath the triangle, the first level of support lies at $324 (.618 Fib). This is followed by support at $317, $306, and $300. The support at $300 is further bolstered by a 6-month-old rising trend line.
On the other side, the first level of resistance lies at $342. Above this, resistance lies at the upper boundary of the triangle, $365 (2019 Highs), and $378 (bearish .382 Fib).
The Stochastic RSI recently produced a bearish crossover signal which sent the market lower. It is still not ready for a bullish crossover to signal an end to the bearish pressure.
ETH/BTC – Ethereum Trading Inside Larger Symmetrical Triangle Against BTC.
Key Support Levels: 0.0315 BTC, 0.0311 BTC, 0.0305 BTC.
Key Resistance Levels :0.033 BTC, 0.0337 BTC, 0.034 BTC.
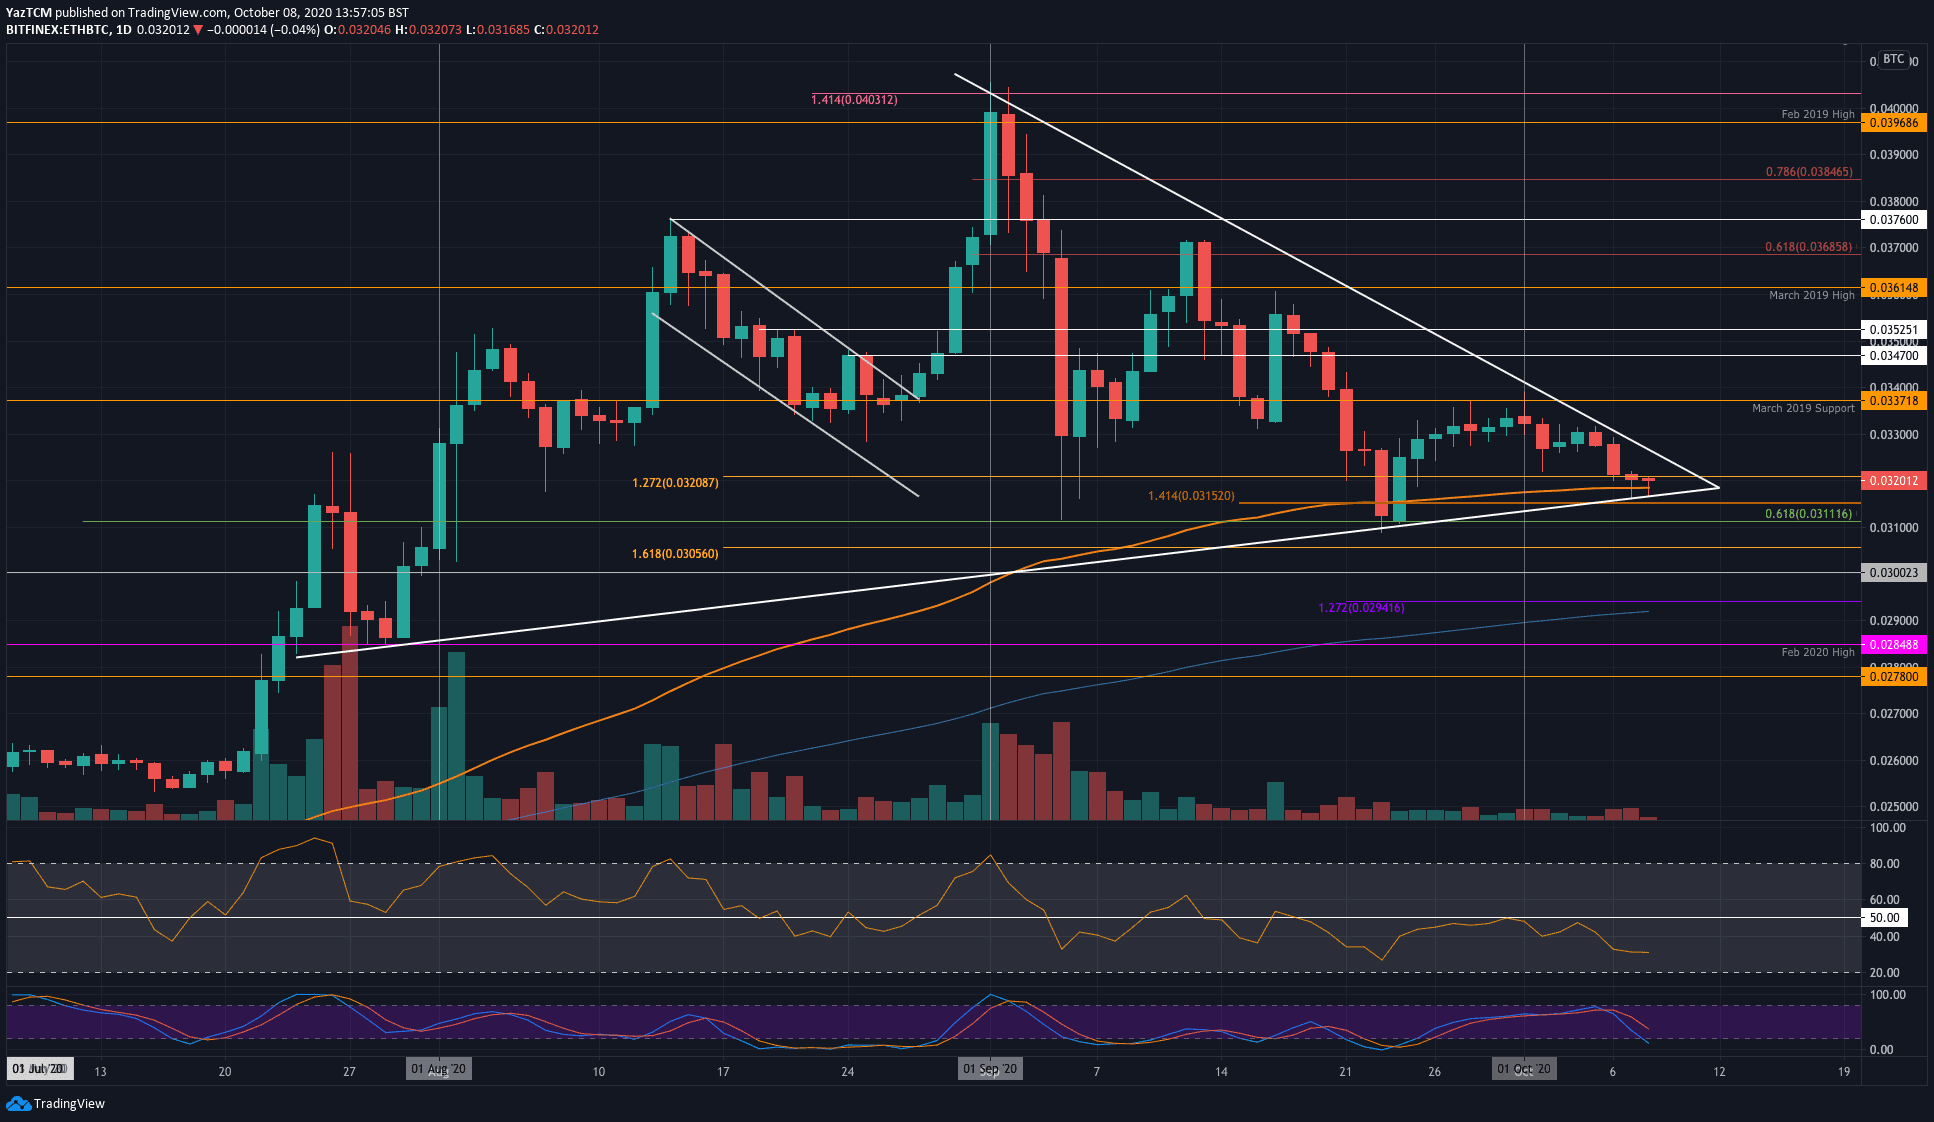
Against Bitcoin, Ethereum is also trading in a larger symmetrical triangle pattern. The coin attempted to break the upper boundary this week but failed which caused it to head lower into the 100-days EMA at around 0.032 BTC.
Likewise, the market is approaching the apex where a breakout can be expected. Hopefully, the bulls can start to regroup to allow the market to break toward the upside – otherwise, it is looking increasingly likely that we will see a lot of downward momentum in the following weeks.

ETH-BTC Short Term Price Prediction
Looking ahead, if the sellers push beneath the triangle and break beneath 0.0315 BTC, support lies at 0.0311 BTC (.618 Fib Retracement), 0.0305 BTC (downside 1.618 Fib Extension), and $0.3.
On the other side, resistance first lies at the upper boundary of the triangle. Above this, resistance lies at 0.033, 0.0337 BTC (March 2019 support – now resistance), and 0.0347 BTC.
The momentum is clearly in the bearish favor as the RSI sits well beneath the mid-line.
Disclaimer: Information found on CryptoPotato is those of writers quoted. It does not represent the opinions of CryptoPotato on whether to buy, sell, or hold any investments. You are advised to conduct your own research before making any investment decisions. Use provided information at your own risk. See Disclaimer for more information.
The post appeared first on CryptoPotato


