Binance Coin despite its immediate bearishness on the hourly charts, remained strong in terms of buying volumes, that might help BNB in its price recovery over the next few days. Cosmos too, although bearish for the day, could be poised for price recovery soon, given its overall uptrend and weak selling pressure.
While Stellar Lumens indicated the presence of some selling sentiment and may continue to remain bearish over the weekend.
Binance Coin [BNB]
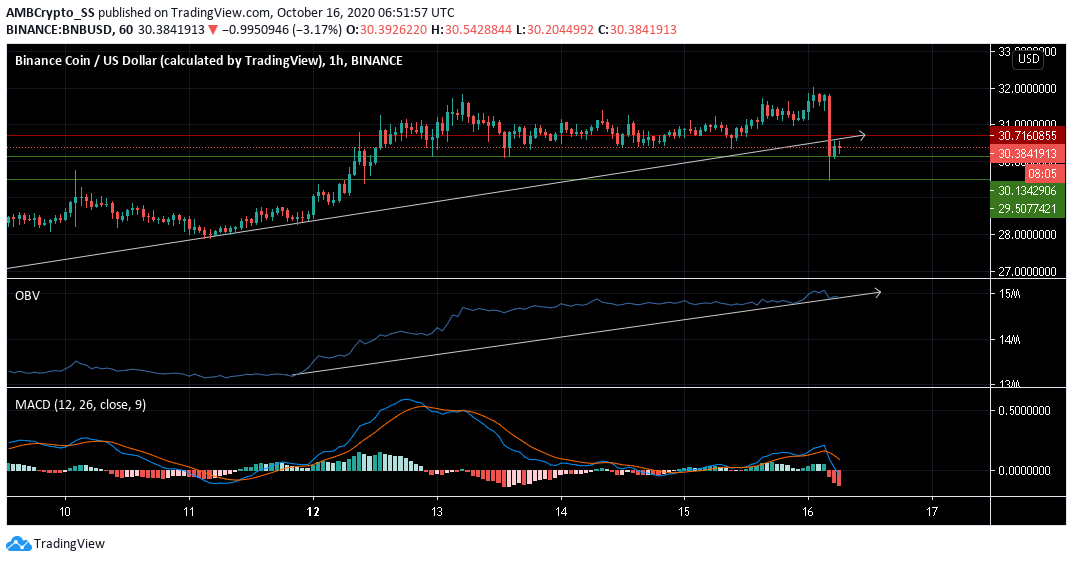
The digital asset seemed to be in a short-term price correction, as Binance coin’s hourly chart recorded a quick sell-off. However, the buying interest in BNB failed to depict a similar trend, maintaining a good buying volume as seen on the OBV.
MACD on the other hand indeed captured a strong sell signal as price dove southwards for the day. There was a bearish crossover as the MACD line moved below the signal line.
Binance coin despite its recent price drop maintained a good level of buying volumes. Its bounced back near the immediate support at $30.134, signaled an uptrend could also be a likely scenario by the weekend.
Stellar Lumens [XLM]
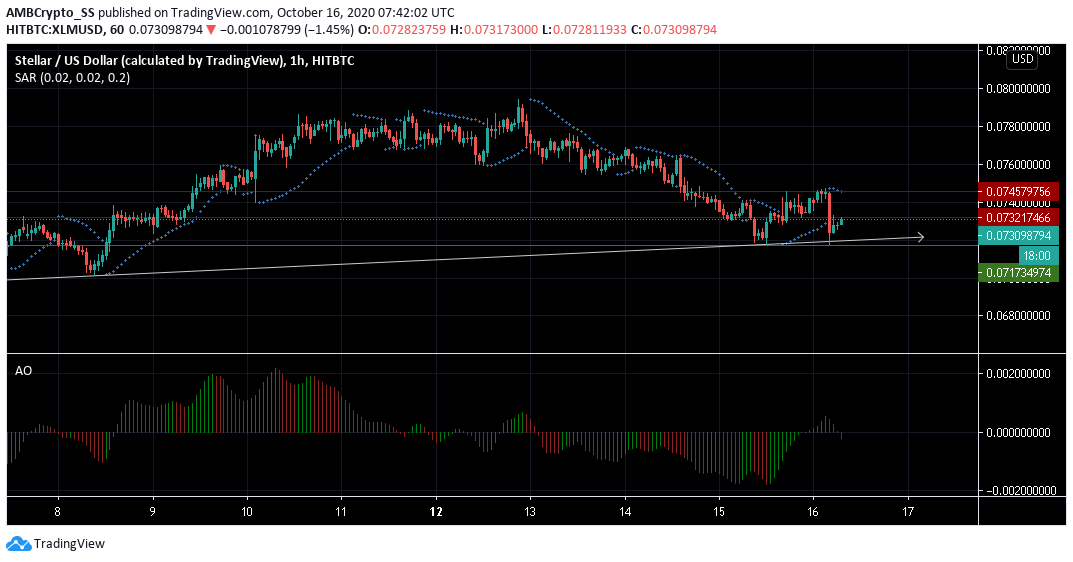
Stellar Lumens (XLM) the native cryptocurrency of the Stellar network, was at the time of writing trading at $ 0.073. It moved above its immediate support level at $ 0.071
While XLM noted an overall uptrend, the digital asset’s trading sessions since 11 October have been bearish. The Awesome Oscillator (AO) was seen making a bearish crossover, diving below the zero line.
With the AO technical indicator giving a sell signal, the dotted lines of the Parabolic SAR above the candles too suggested a downward price action.
A pullback from the current resistance may be encountered in the upcoming trading sessions.
Cosmos [ATOM]
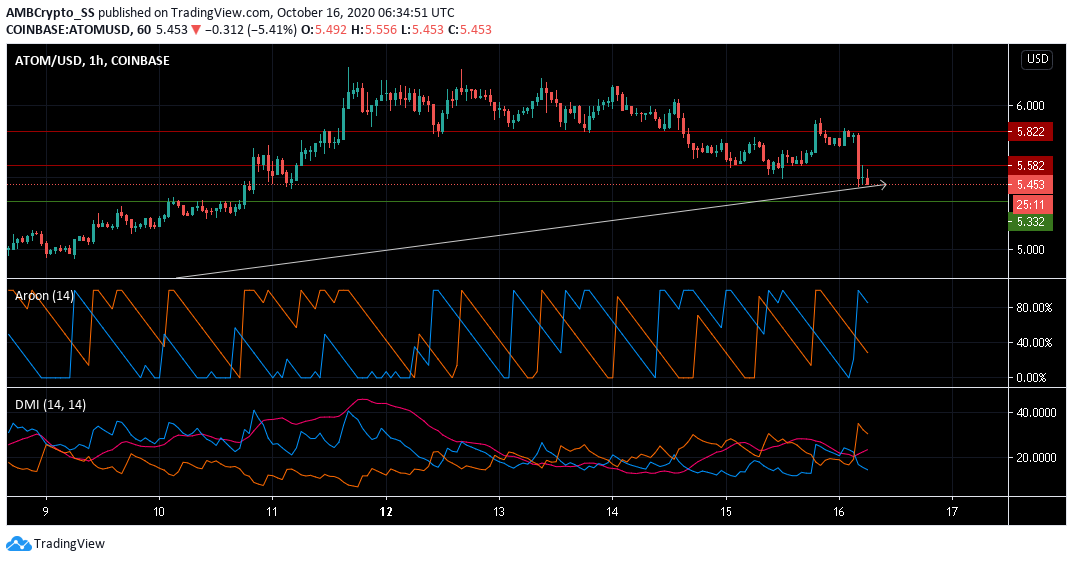
Approaching the weekend, Cosmos was maintaining an overall uptrend. The digital asset at press time was trading just above its trendline and the pivot level at $ 5.453.
The Directional Movement Index, DMI with its -DMI(orange) above the +DMI (blue) gave a sell signal. Aroon Indicator too, indicated short-term bearishness, as the Aroon Up (orange) dived below the Aroon Down (blue).
But given the digital asset’s overall uptrend and if the bears fail to maintain a strong selling pressure, prices might bounce back up from the immediate support of $ 5.332 in the next few trading sessions.
The post appeared first on AMBCrypto


