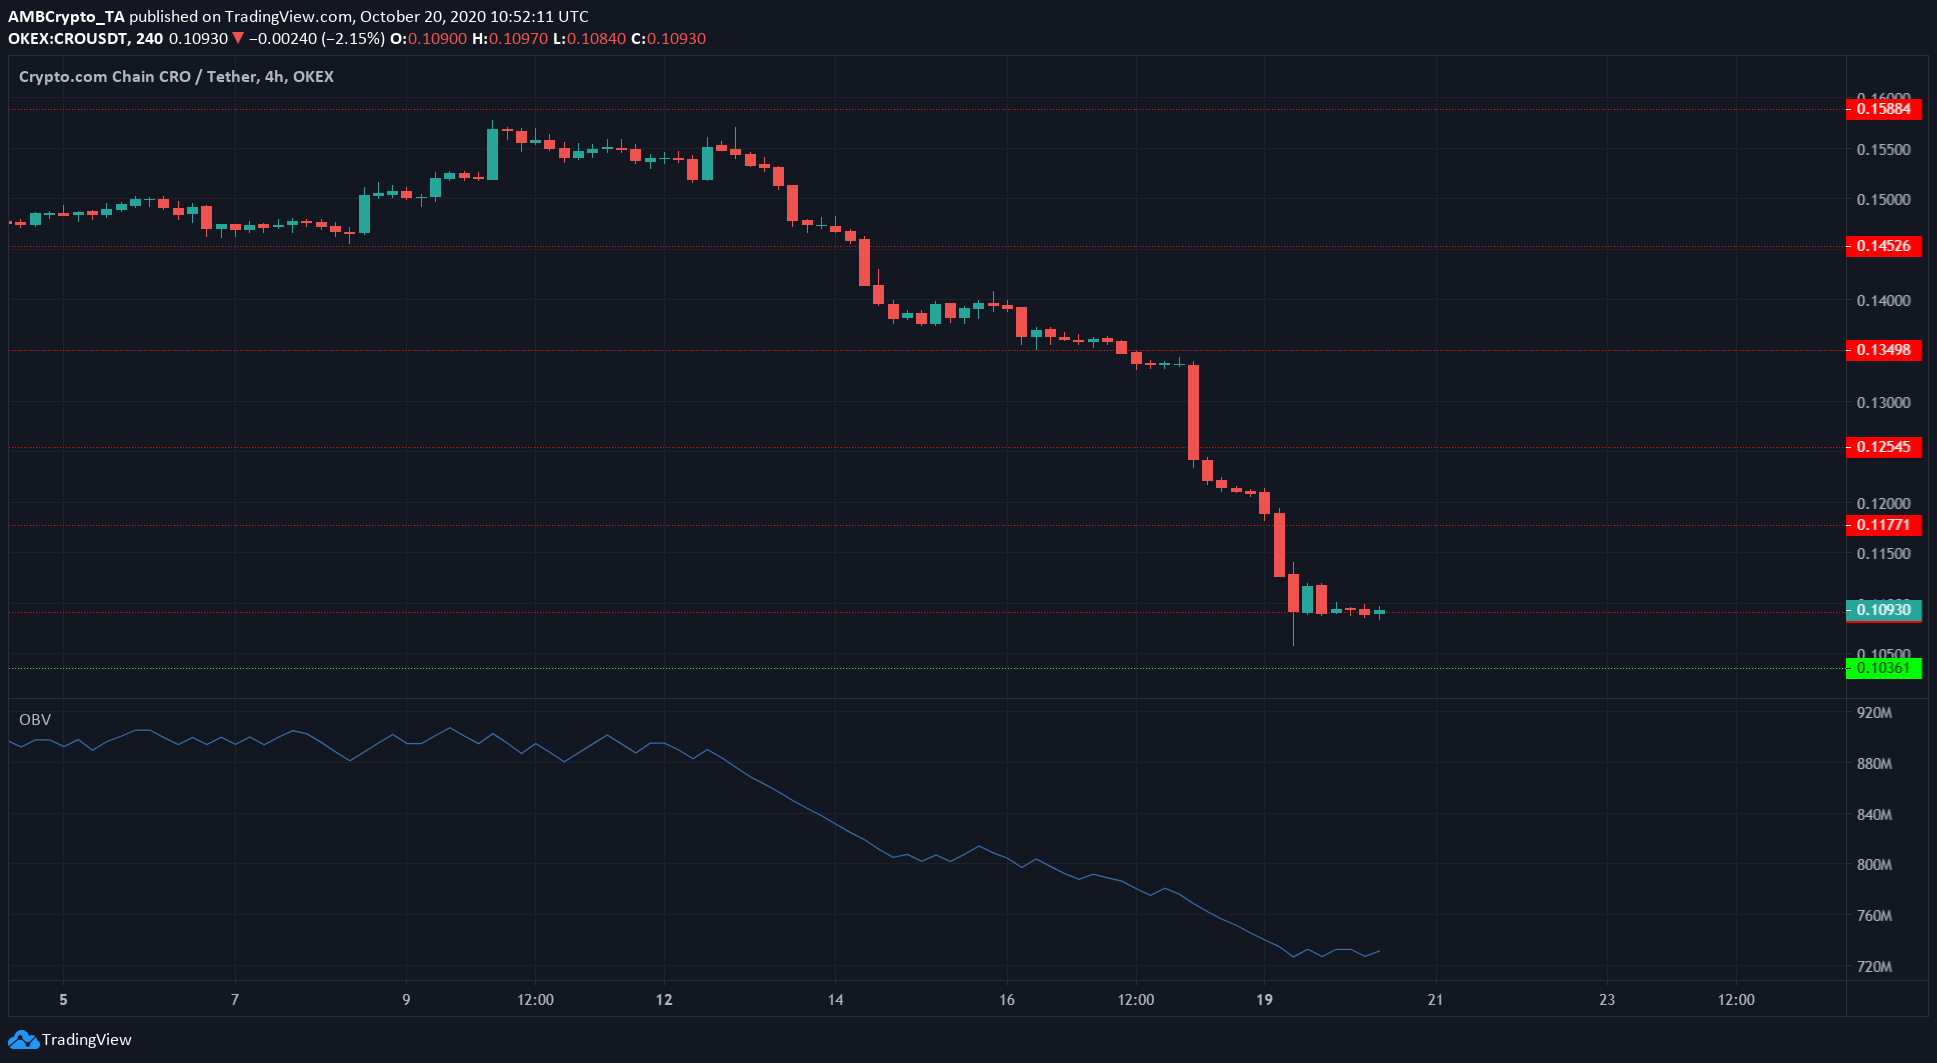
Crypto.com Coin was already in a strong wave of selling pressure before Bitcoin’s recent break toward $12,000 further pulled capital out of the altcoin market. At press time the king coin was trading at $11,766 with a 24-hour trading volume of $132.6 billion.


Source: CoinStats
FTX Token faced a critical resistance it has been unable to close above for a month despite multiple attempts. Ontology formed a bearish pattern, faked a break to the upside, and could be headed downward.
Crypto.com Coin [CRO]


Source: CRO/USDT on TradingView
News that Crypto.com was slashing the staking rewards for the exchange’s token, CRO, by 70% just before announcing that the exchange had reached a userbase 5 million, caused a cascade of sell orders on CRO as traders and investors pulled out.
The OBV confirmed the wave of selling pressure as it steadily trended downward after staying quite flat in recent weeks.
Ontology [ONT]


Source: ONT/USD on TradingView
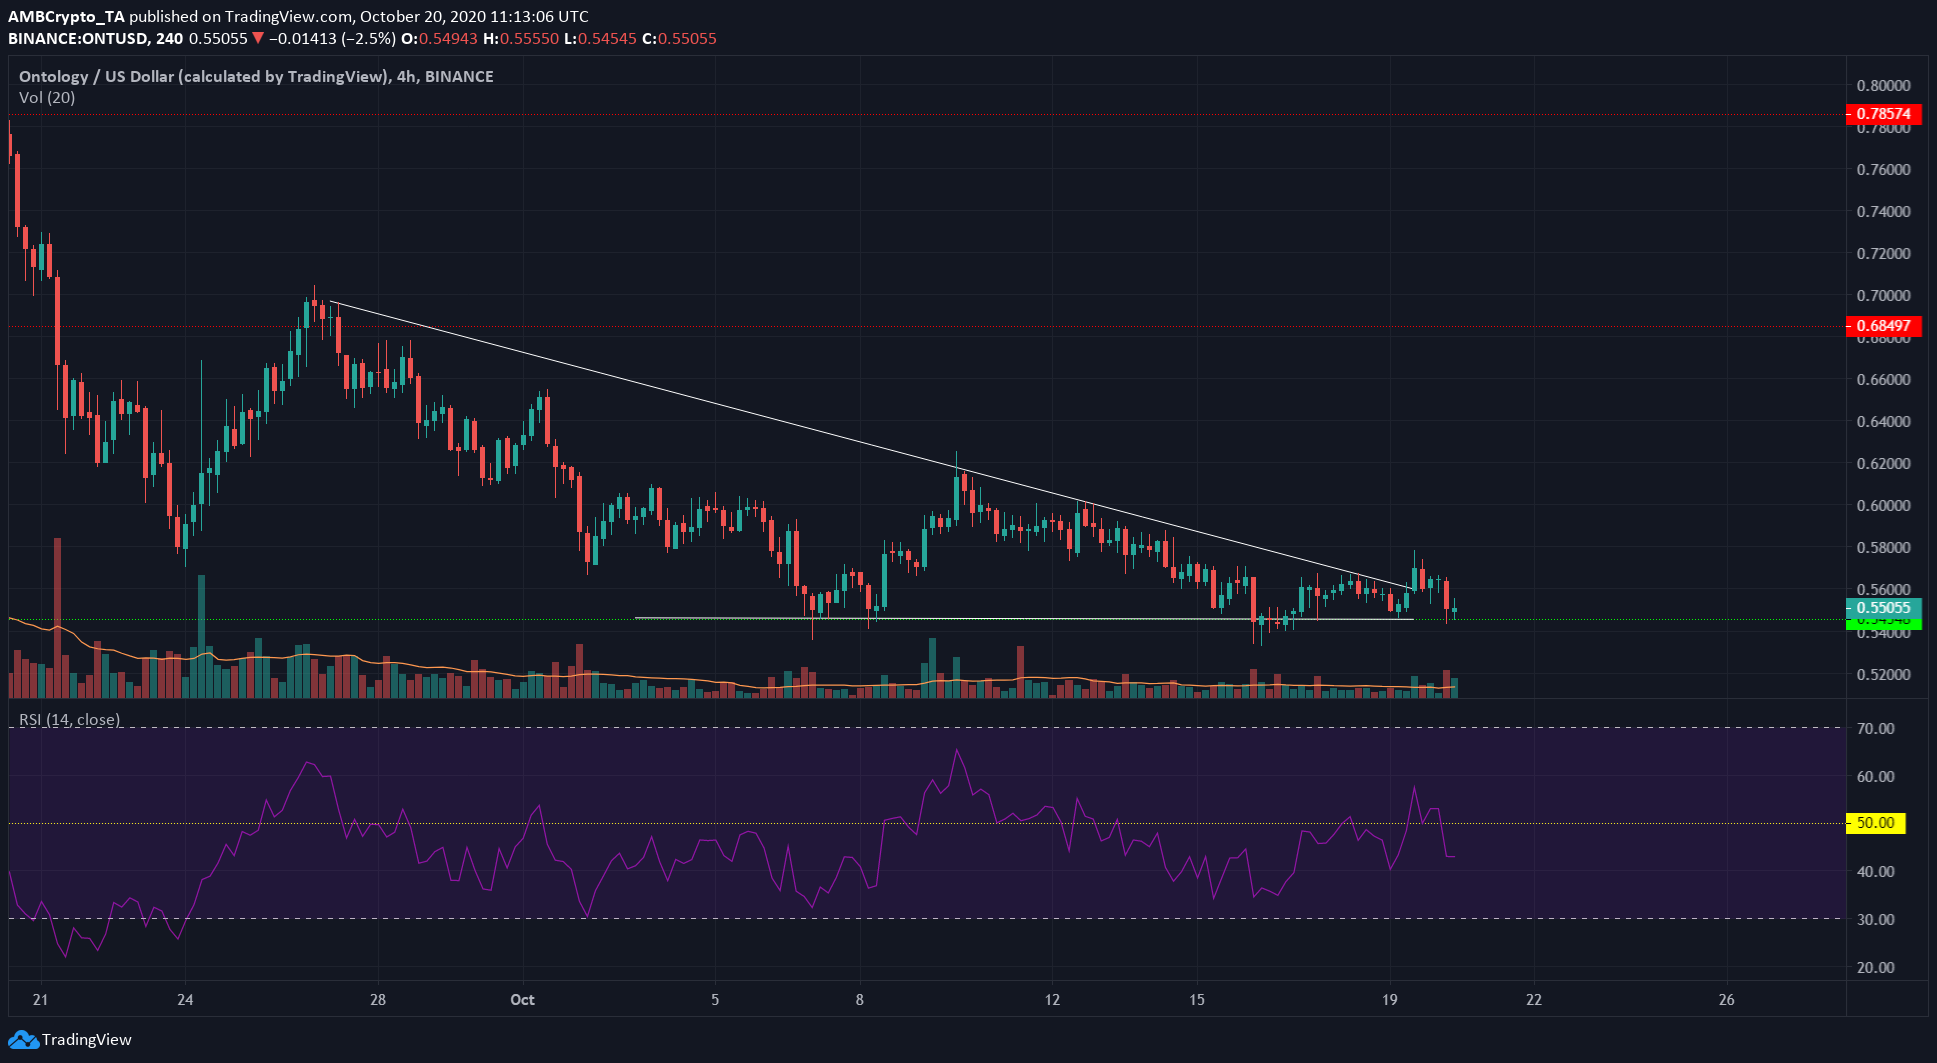
In white is a descending triangle, a bearish pattern that could see ONT go as low as $0.44. However, the bearish pattern was partially invalidated as the price closed above the descending trendline.
That rise could have been a stop loss hunting trip and ONT can still be headed downward. A close below $0.54 on good trading volume would be a good entry for a short position with $0.49 as a take-profit level.
If the price does not descend below $0.545 in the coming hours, the entire bearish setup can be considered to be invalidated and ONT could enter a period of consolidation.
FTX Token [FTT]


Source: FTT/USD on TradingView
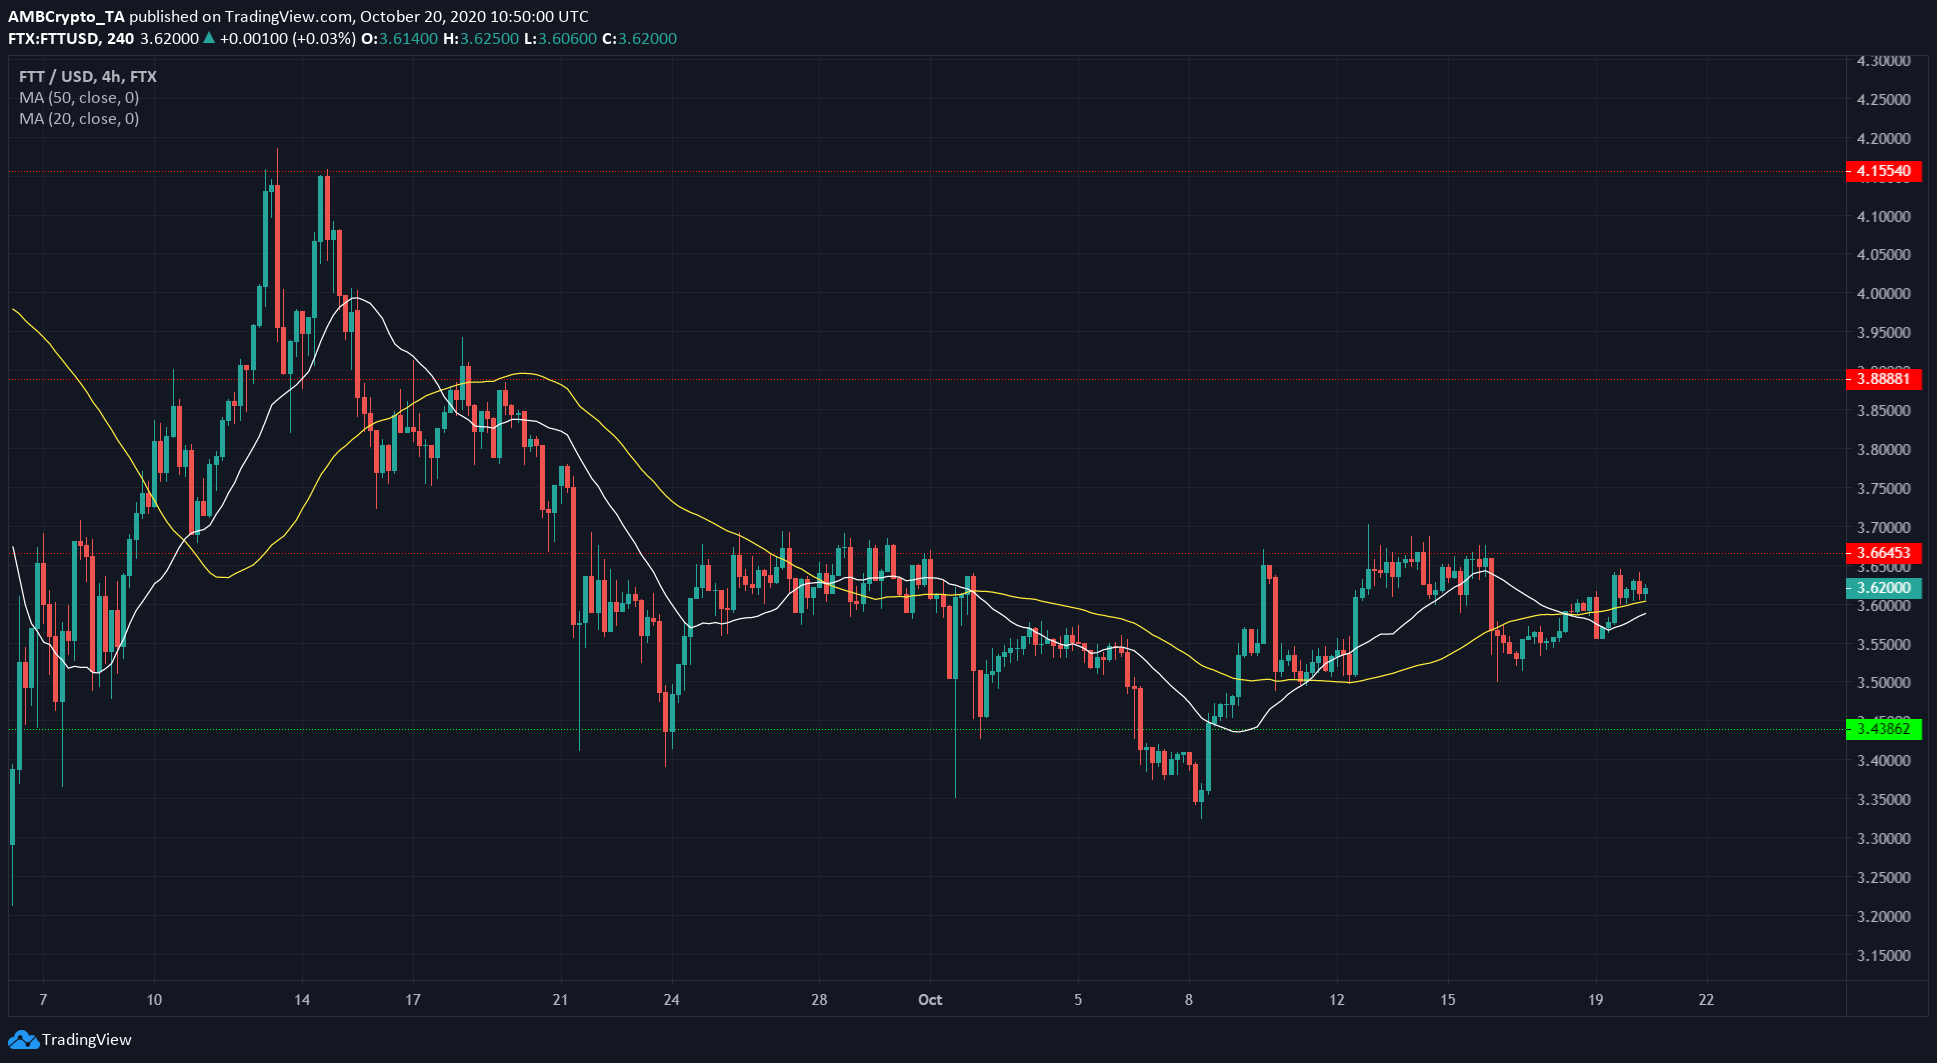
The $3.66 level has been stubbornly resisting FTT bulls for nearly a month now. The recent rise toward the same level saw FTT register higher lows, suggesting a breakout beyond $3.66 could be possible.
The price also respected the 50 SMA (yellow) as support in recent trading sessions. A break below the moving average could undo the momentum gathered.
FTT’s break to the upside might not materialize, at a time when Bitcoin was making strong moves to the upside alongside a rising Bitcoin Dominance.
The post appeared first on AMBCrypto


