Disclaimer: The findings of the following article are the sole opinion of the writer and should not be considered investment advice
Cardano, the cryptocurrency ranked 10th on the charts, was on quite an upwards trajectory for most of the second and third quarters of 2020. Since July, however, ADA seems to be doing nothing, but correcting itself. In fact, between 27 July and 31 August, a 50% drop was noted on the charts.
The following analysis will expand on what to expect from ADA’s price over the next week or two.
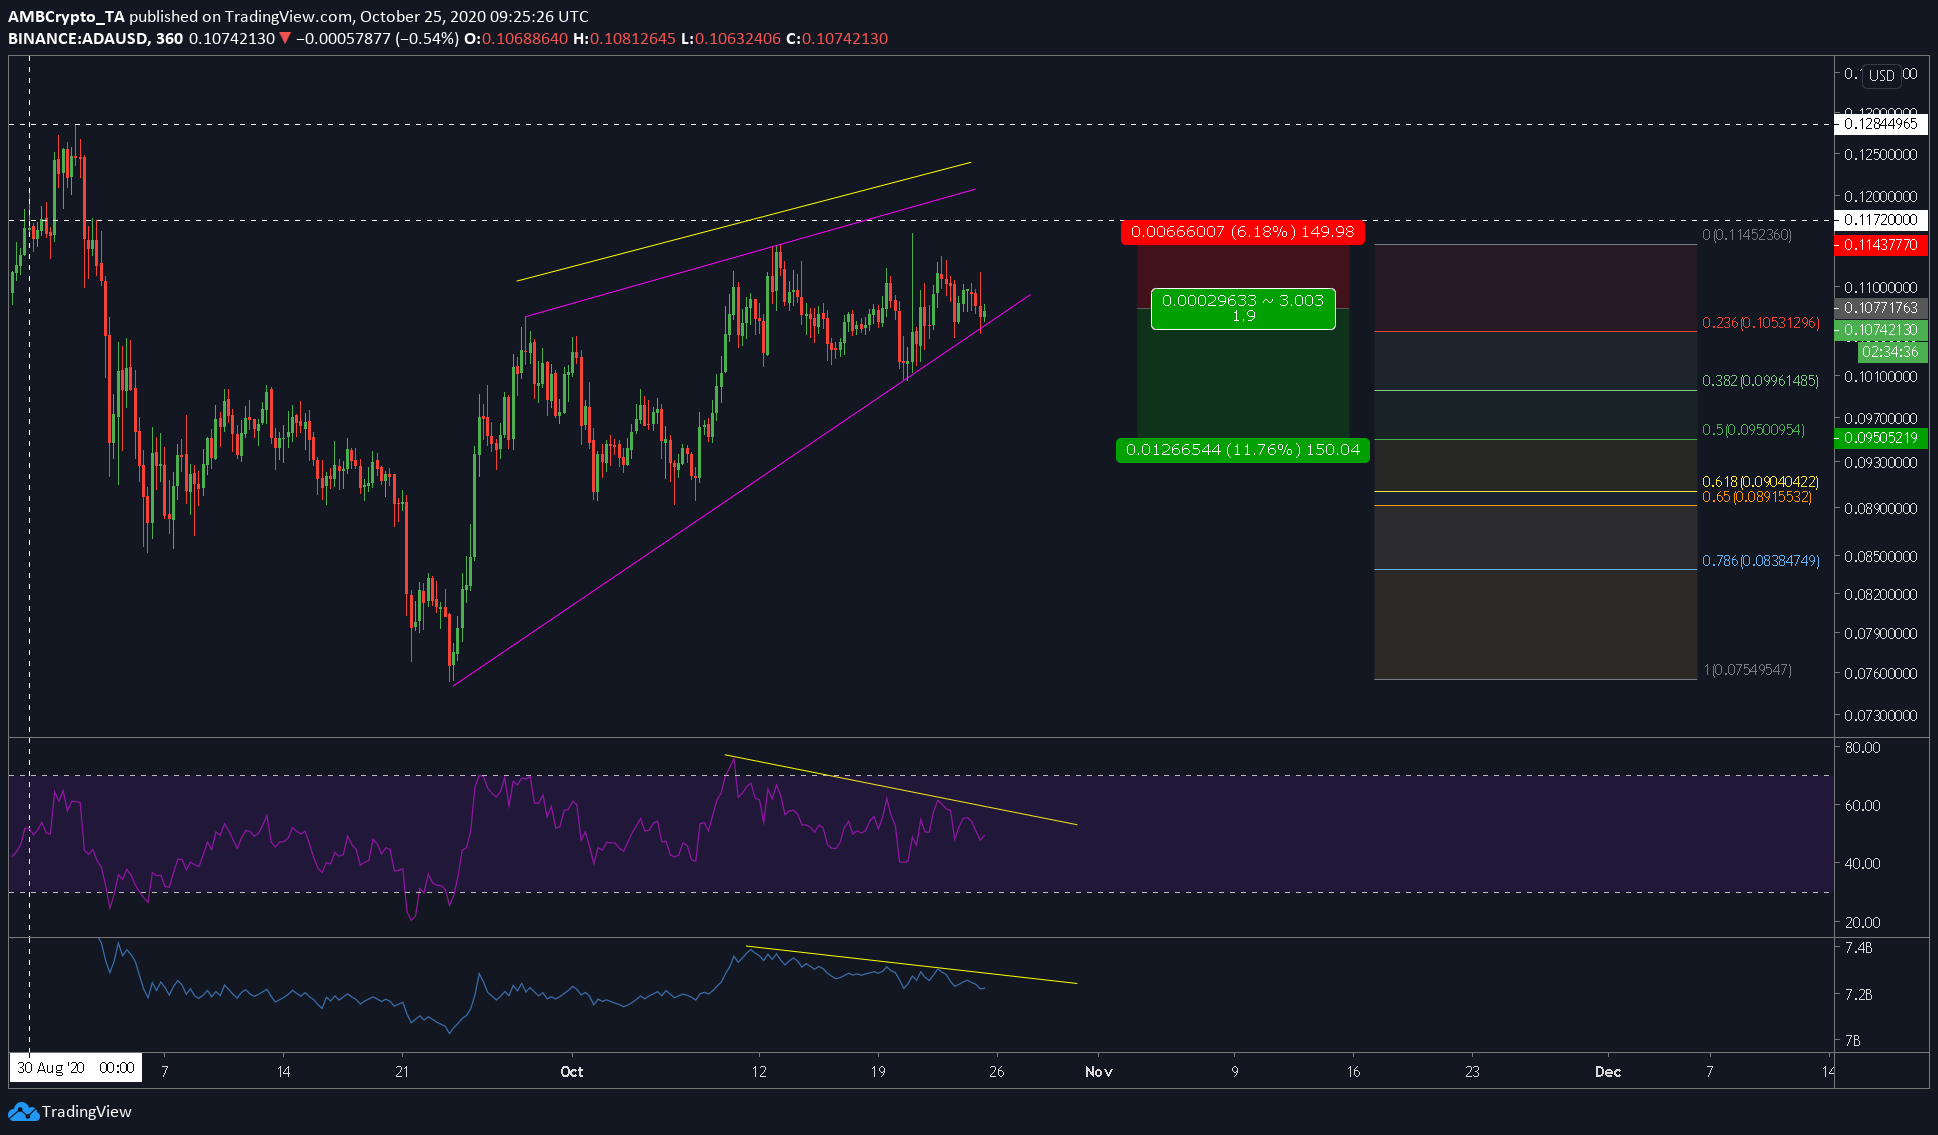
Cardano 6-hour chart


Source: ADAUSD on TradingView
The attached chart has multiple aspects to it, so let’s go over them, starting with if ADA looked bearish or bullish. The pattern formed, a ‘rising wedge,’ is a bearish pattern. Hence, the bias was towards the bears and a short trade could be taken here.
Moving on, the pattern was almost at an end at press time, meaning, a breakout can be expected soon, one that will result in the price breaking downwards. The levels to keep a close eye on include – 0.382-Fibonacci level at $0.09961, 0.5-Fibonacci level at $0.095, and the golden pocked ranging from $0.09040 to $0.0891.
The aforementioned levels could be potential take-profit levels on a short trade.
Rationale
The rationale for entering a short position on ADA, apart from the rising wedge pattern, includes the RSI and the OBV indicators, which indicated a bearish divergence. The RSI, OBV had both fallen while the price was on the rise – a bearish divergence – adding to the aforementioned bearish bias.
Levels to look out for
Opening a short position seems like the best option. Hence, these are the levels.
Entry: $0.10771763
Stop-loss: $0.11437770
Take-profit: $0.09961, $0.09505, $0.090404
Risk-to-reward: ~1.9 [for the second take-profit level]
Depending on your risk appetite, one could even wait until the last target [$0.0904] is achieved. This would yield an R of ~2.61.
Overall, the ADA ecosystem seemed due for another correction. However, one potential scenario that could rewrite the bearish bias is Bitcoin. If Bitcoin were to surge explosively, then altcoins would follow it, no questions asked.
Hence, one should understand the risks, especially at a time when Bitcoin has already hit a level [$13,000] last seen about 15 months ago.
The post appeared first on AMBCrypto


