While Bitcoin SV must have felt good upon its recent re-test at $180, its quick decline to $163 would have made things a little complicated. As the market followed Bitcoin’s cue, a bearish trend was evident on every altcoins chart and BSV was no different. With a market cap of $3 billion, BSV was back in the top-10 but analysis suggested that the future trading period is widely uncertain.
Bitcoin SV 12-hour chart
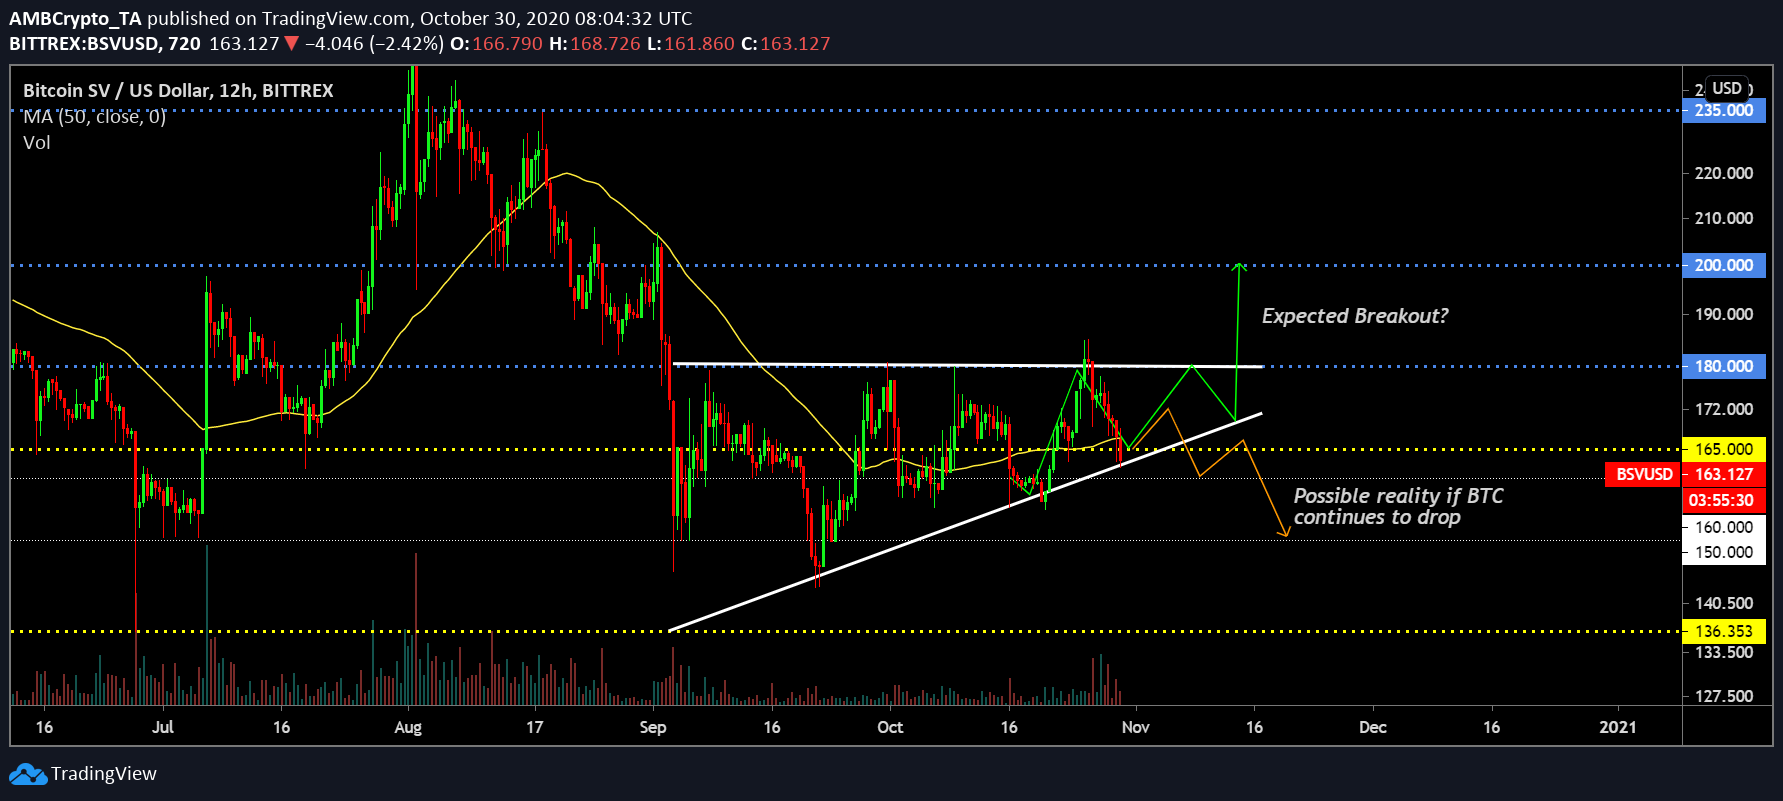
At the moment, Bitcoin SV continued to oscillate between the trend lines of an ascending triangle. While the pattern does carry bullish implications, with BSV conducting adequate lower highs with the bottom trendline, the market impact of Bitcoin looms large. If the market structure is held right, the expected bullish breakout above $180 should unfold during the 2nd-3rd week of November.
However, further bearish pressure from the collective industry might trigger a fakeout for the altcoin, as determined by the orange pathway (a likely re-test scenario). Bitcoin SV remained just under $165 at the moment and the asset can be dragged down to further support at $160, and possibly down to $150 if bearish pressure persists. Key resistance remains $180 and $165, while long-term support is $150.
Reasoning
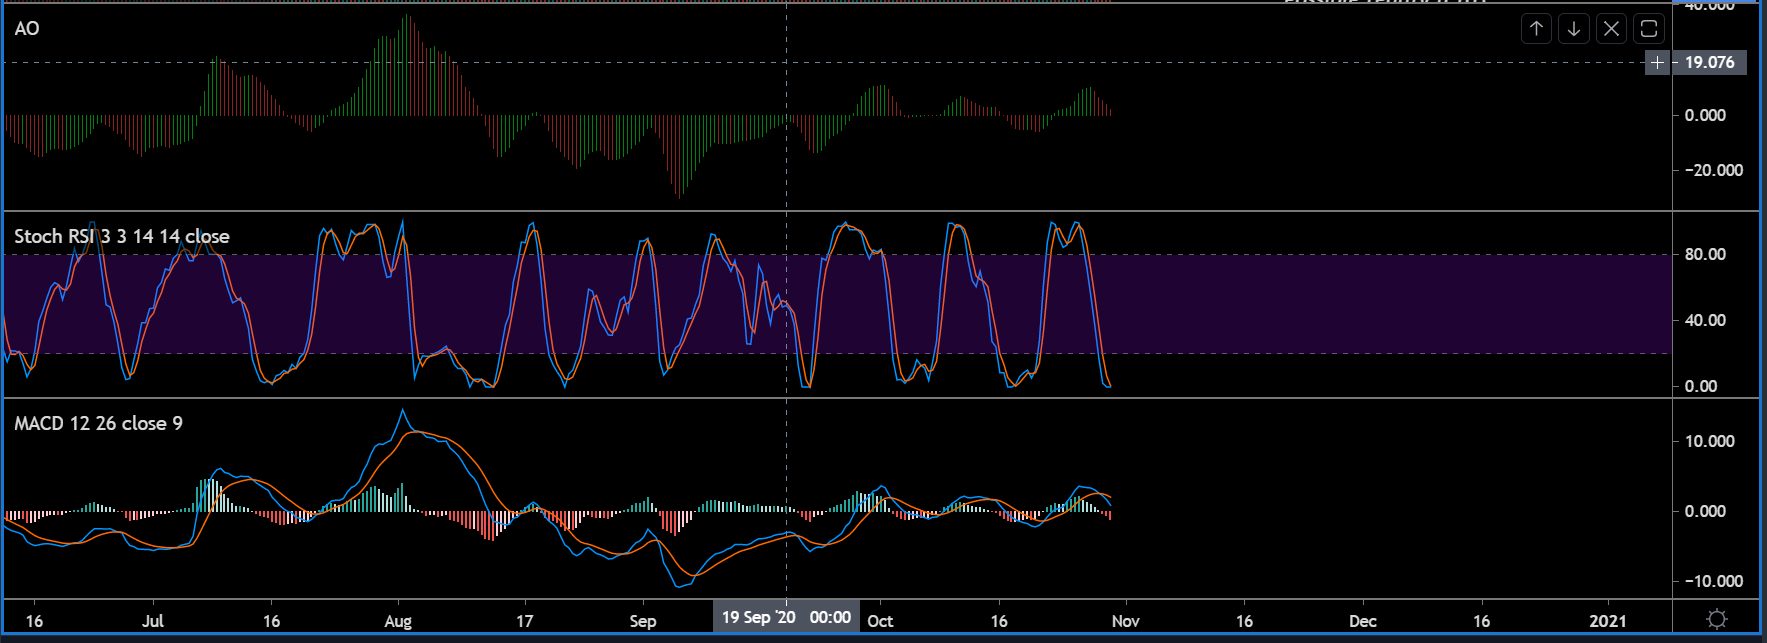
Clear reasoning for an uncertain trend over the next couple of weeks can be illustrated by the market indicators. Stochastic RSI suggested a likely bullish turnaround for the asset. The blue line is undergoing a potential crossover with the orange line at the over-sold region. Now, the counter bearish argument is pictured by the remaining indicators and MACD just entered a strong bearish zone.
Awesome Oscillator suggested weak bearish momentum for the time being but signs of a bullish rally were minimal.
Conclusion
The major issue with Bitcoin SV remains its correlation with Bitcoin. BTC just completed its massive bullish rally and it is currently eyeing a period of correction. While BSV did not rally with BTC during the bullish spell, it might follow its lead during the bearish one.
The post appeared first on AMBCrypto


