Bitcoin has registered a considerable surge of 40% over the last 4 weeks. This week, in fact, as of this writing, Bitcoin had surged by a significant 5.47% on the charts. Perhaps, the $14,000-level could be a local top and we might retrace. However, it is too soon to ascertain that without looking into the technical aspects of Bitcoin.
Bitcoin 1-hour chart


Source: BTCUSD on TradingView
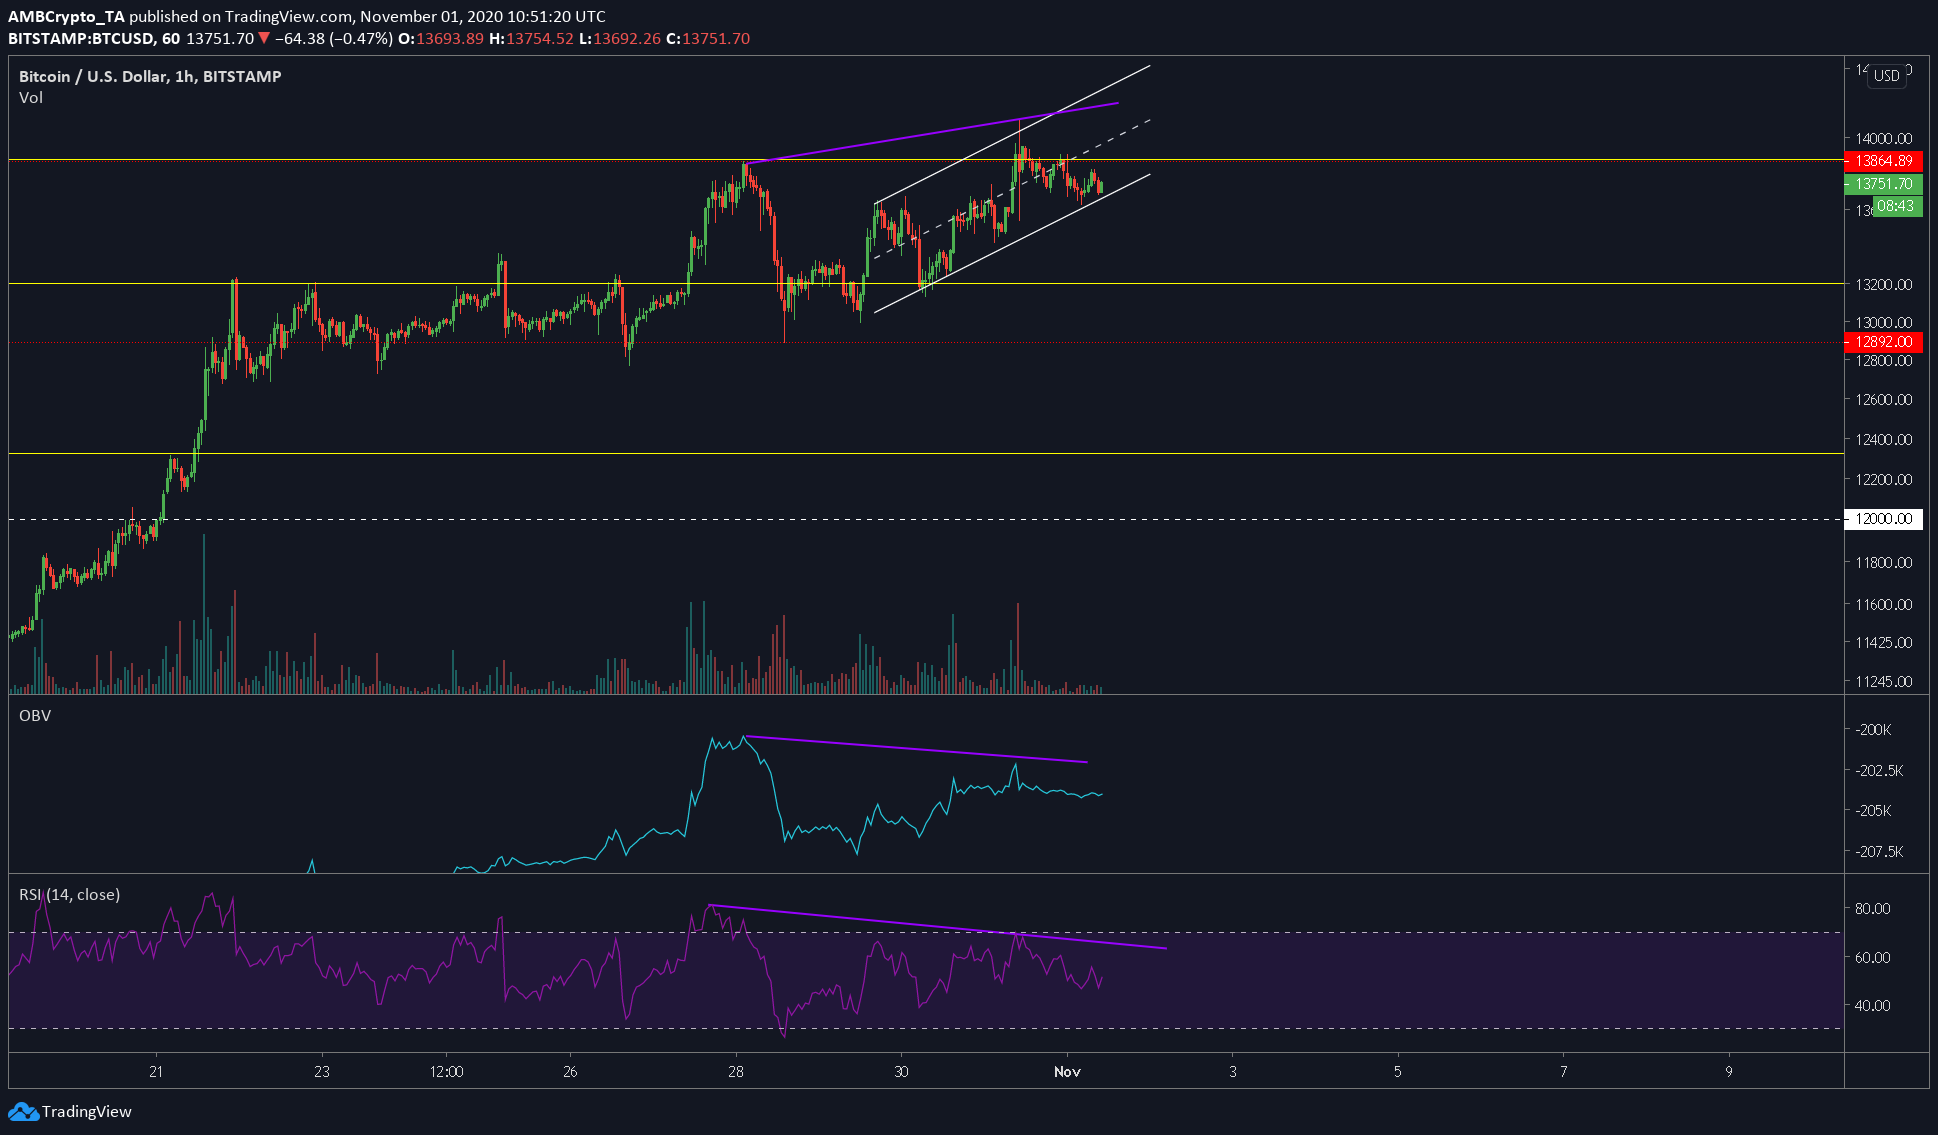
The one-hour chart for Bitcoin noted an overall bearish bias to the coin over a short-term timeframe. Confirming the same were other aspects that can be seen by observing the chart attached above.
Let’s look into the pattern that Bitcoin was forming on the charts – Ascending channel. This is an inherently bearish pattern, one that breaks out to the downside. At press time, Bitcoin had tapped the lower part of the channel and might breakout soon.
Levels that matter included $13,864, $13,200, and $12,325 [3 yellow lines]. At press time, it was likely that Bitcoin’s breakout could push the price lower towards $13,200. BTC’s technical indicators can back this up as well.
The OBV and RSI were both exhibiting a bearish divergence [purple line] with the price. The price has already seen a part of this divergence as Bitcoin dropped from $14,097 to $13,700. Moreover, this bearish divergence is in line with the pattern’s breakout direction. Hence, we can expect BTC to head lower on the charts.
The important level to keep an eye out for includes $13,200 [second yellow line], wherein the initial drop will push BTC down to $13,200 and then to $12,982 [red line]. This will result in 3% and 6% drops, respectively.
Conclusion
Although the short position looks favorable, in light of how Bitcoin has defied technical analysis, this trade will not be worth it, especially if Bitcoin does move higher.
Moreover, the breakout point wasn’t clear yet at press time, hence, we can expect the price to bounce from its current position [at the bottom of the channel] towards the top of the channel. This will invalidate stop-losses, if any. Hence, the best thing to do is to wait, until a clear trend or breakout is noticed.
The post appeared first on AMBCrypto


