Disclaimer: The findings of the following article attempt to analyze the emerging patterns in Polkadot’s short-term market and its impact on the price
The eighth-largest coin, as per the CoinMarketCap listing, Polkadot [DOT] has been one of the major altcoins in the market. The project has noted great interest from the crypto users and as per its price chart, it has been witnessing a notable increase in its value over the past week.
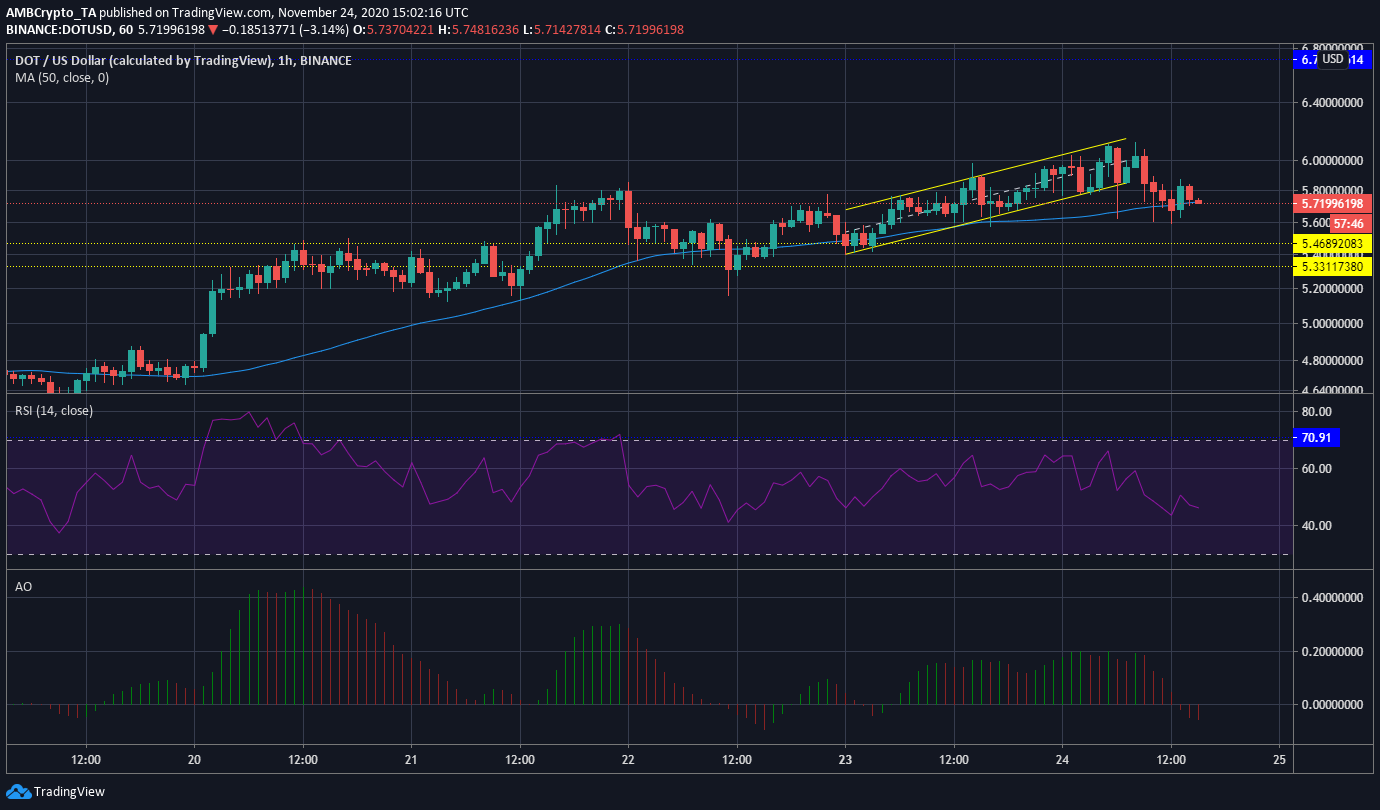
At the time of writing, the digital asset has broken down from a bearish trend and was valued at $5.71.
Polkadot 1-hour chart


Source: DOT/USD on TradingView
The above chart of DOT noted the rising value of the digital asset along an ascending channel, however, instead of witnessing a push upwards, the price broke down. The value peaked at $6.10, following which it began its descent.
The dropping price has finally stabilized, however, it may not witness a price swing anytime soon.
Reasoning
The reason for DOT’s consolidation is that currently, the market has been witnessing the selling and the buying pressure being equaled. This was highlighted by the Relative Strength Index, which was going to surpass the overbought territory as the price appreciated. However, the fall has brought the buying and selling pressure to a level.
Whereas the Awesome Oscillator indicated a rise in the short-term selling and the value turned negative, indicating a low momentum. As the digital asset did not have enough short-term momentum to carry one, we may see the value move sideways.
Conclusion
As DOT’s price recently broke down from a bearish trend, the price may not see another move in the short-term for the time being. The consolidating price of the asset is given rise to bearish pressure in the market, however, the asset may move close to the $5.7 price level.
The post appeared first on AMBCrypto


