ADA/USD – Bearish Divergence Sends Market Lower
Key Support Levels: $1.07, $1.00, $0.944.
Key Resistance Levels: $1.20, $1.32, $1.40.
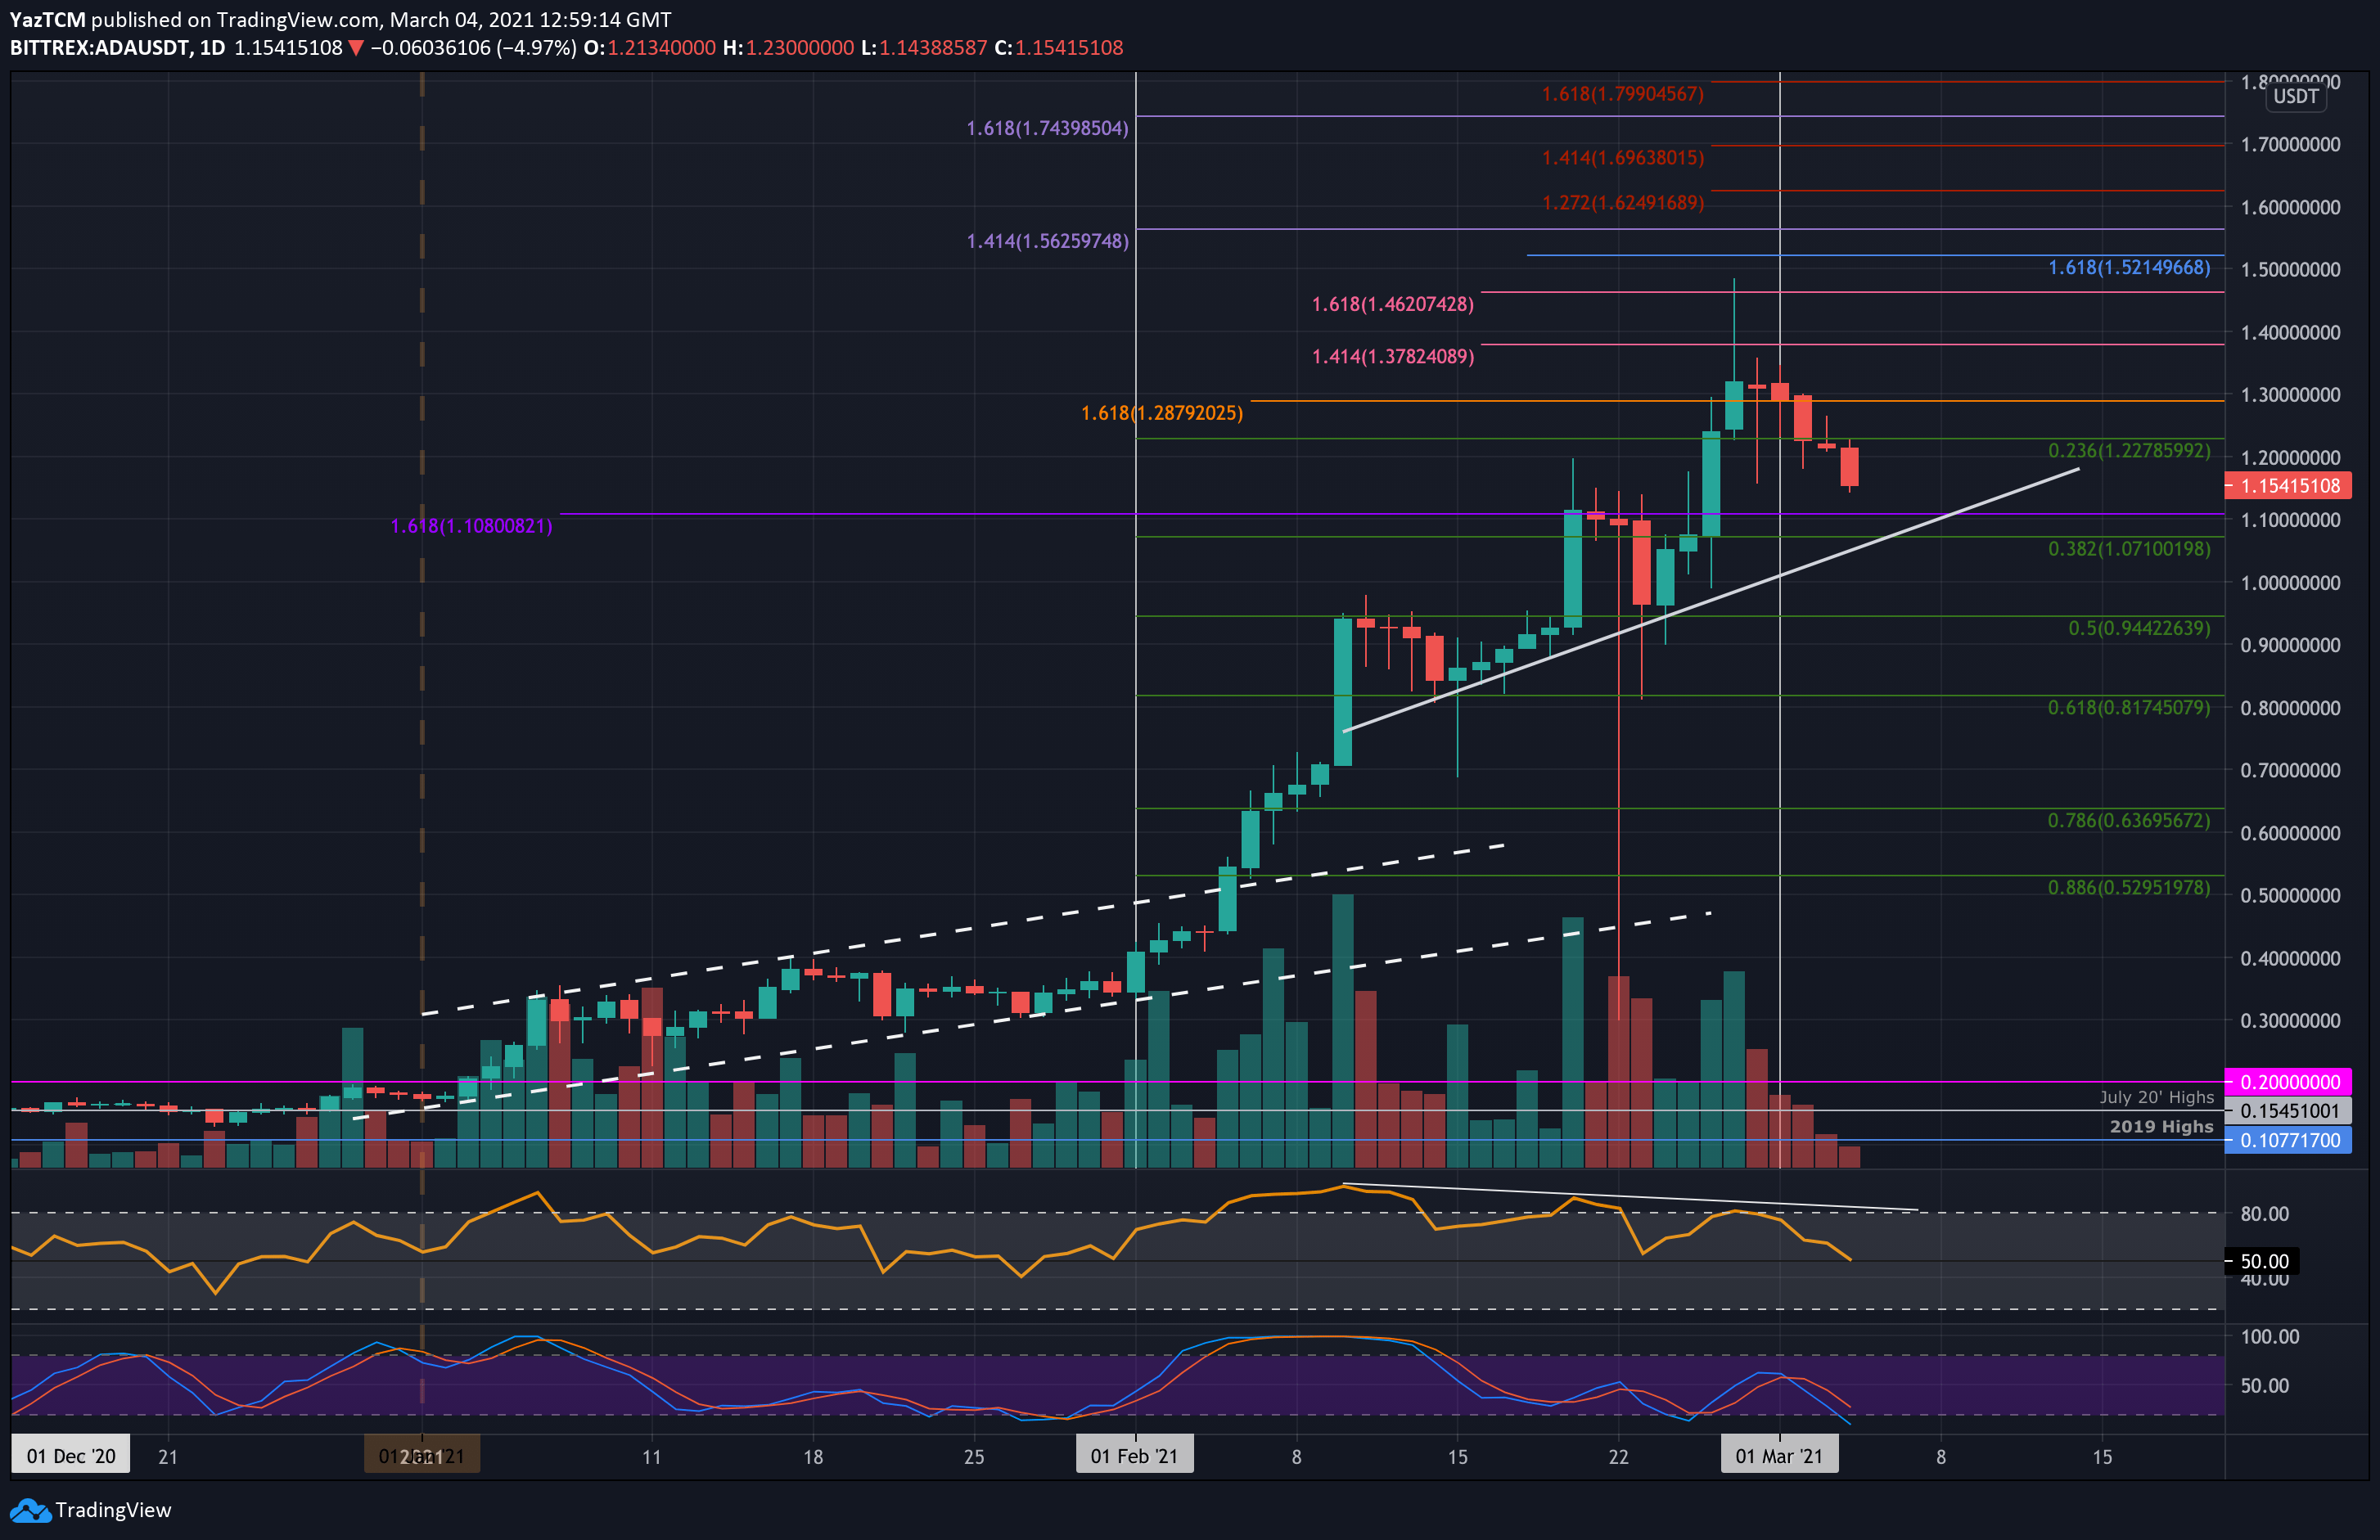
ADA is down by 9% as it falls beneath the support at $1.22 (.236 Fib) to reach $1.14. The cryptocurrency is now down by a total of 23% since hitting the ATH price at $1.48 last week. Nevertheless, ADA is still up by a whopping 224% over the past month of trading, so the retracement could be somewhat expected.
There were hints of bearish divergence since mid-February as price action continued to make higher highs, while the RSI momentum indicator was making lower highs. This resulted in the cryptocurrency rolling over after hitting the ATH price last week.

ADA-USD Short Term Price Prediction
Looking ahead, the first level of support lies at $1.07 (.382 Fib & ascending trend line). This is followed by $1.00, $0.944 (.5 Fib), and $0.817 (.618 Fib).
On the other side, the first resistance lies at $1.20. This is followed by $1.32, $1.40, and $1.48 (ATH). Beyond the ATH, added resistance lies at $1.62 (1.272 Fib Extension – red) and $1.69 (1.414 Fib Extension – red).
As mentioned, the RSI was showing signs of bearish divergence. It has now dropped into the midline, indicating the bullish momentum seen throughout February has completely faded. If it continues beneath 50, the bearish momentum will gather steam and is likely to cause ADA to drop toward $1.00 again.
ADA/BTC – Bulls Attempt To Defend .5 Fib
Key Support Levels: 2200 SAT, 2146 SAT, 2000 SAT.
Key Resistance Levels: 2456 SAT, 2500 SAT, 2800 SAT.
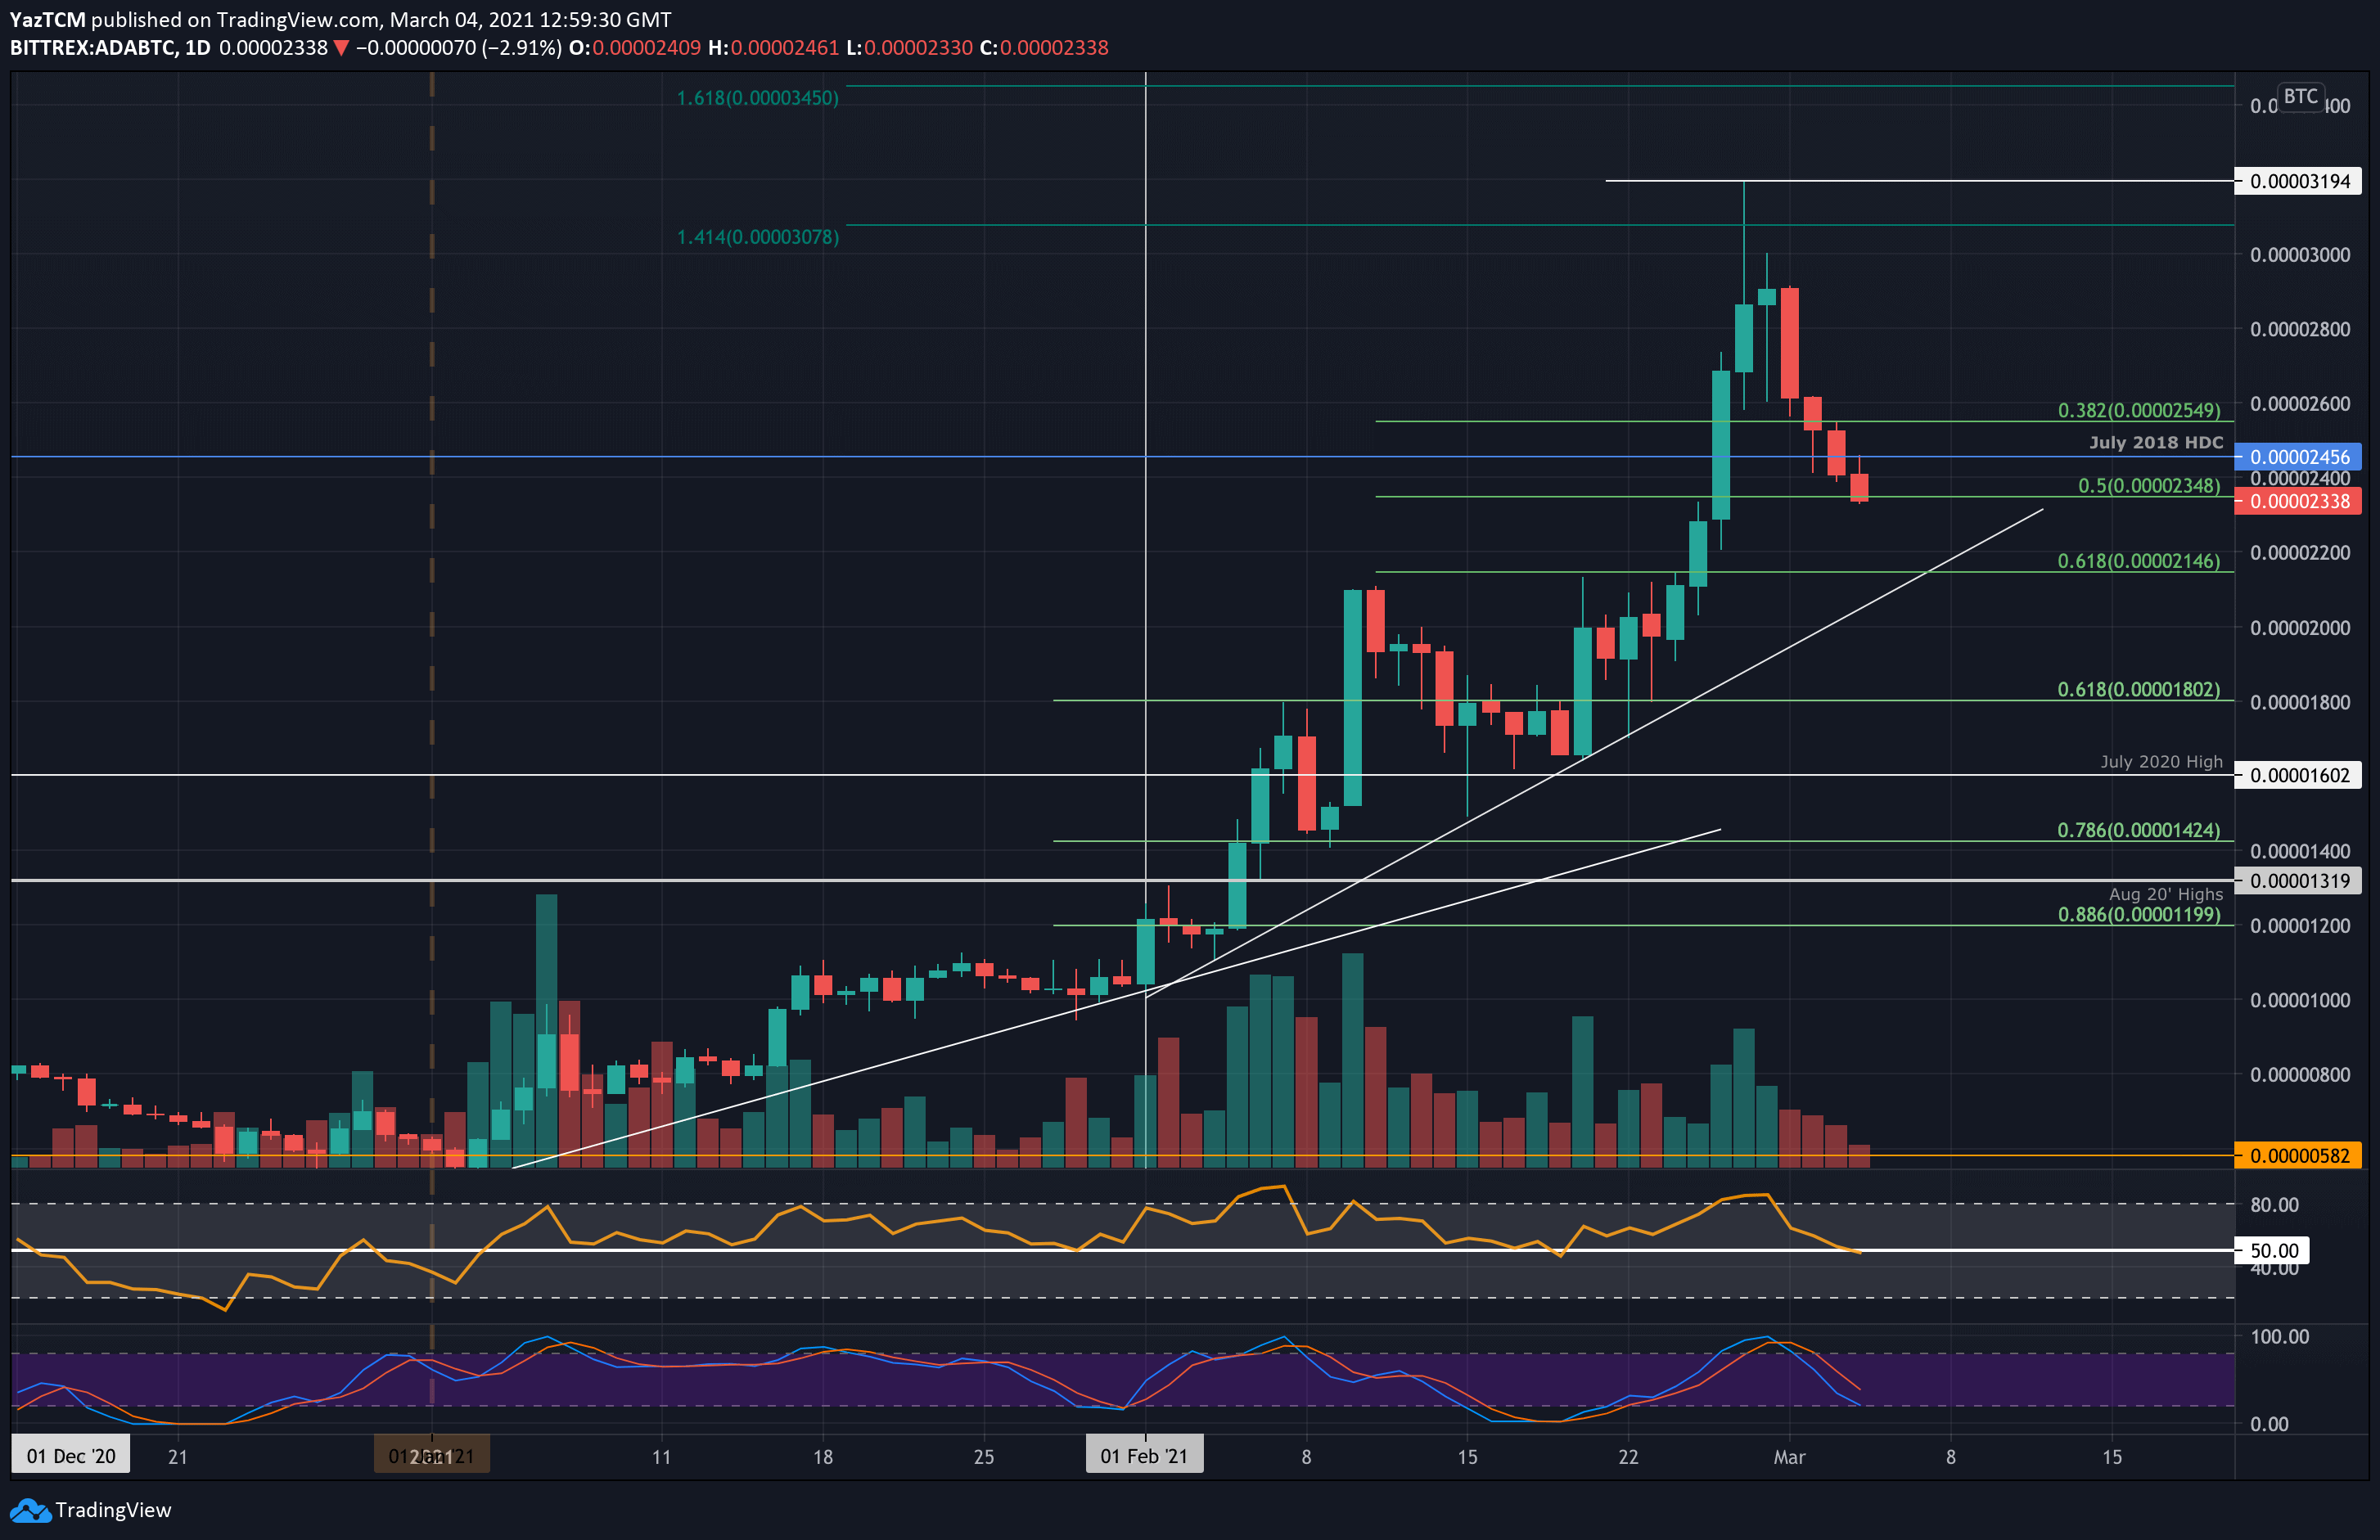
Against Bitcoin, ADA is also heading lower from the 3194 SAT high printed last week. The coin is now down by a total of 27% from this high as it attempts to defend the support at 2350 SAT (.5 Fib Retracement).
A closing candle beneath this support is likely to send ADA lower into the ascending trend line that supported the market during February 2021.

ADA-BTC Short Term Price Prediction
Looking ahead, the first support lies at 2200 SAT. This is followed by 2146 SAT (.618 Fib & Ascending trend line), 2000 SAT, and 1800 SAT.
On the other side, the first resistance lies at 2456 SAT (July 18 High-day Closing price). This is followed by 2600 SAT, 2800 SAT, 2900 SAT, and 3000 SAT.
Likewise, the RSI has returned to the midline here, indicating the previous bullish momentum has faded. If it continues beneath 50, the bearish momentum will take over and push ADA toward 2150 SAT.
The post appeared first on CryptoPotato


