The XRP’s price might have taken a hit over the past few days falling the Bitcoin dump. The coin has been moving towards stabilizing its price, but with the bears in the market, the recovery has been difficult. The short term prediction point towards a fall and rise trend in XRP’s price, while the long term prediction marks the return of an old fractal pattern.
1-Day

Source: Trading view
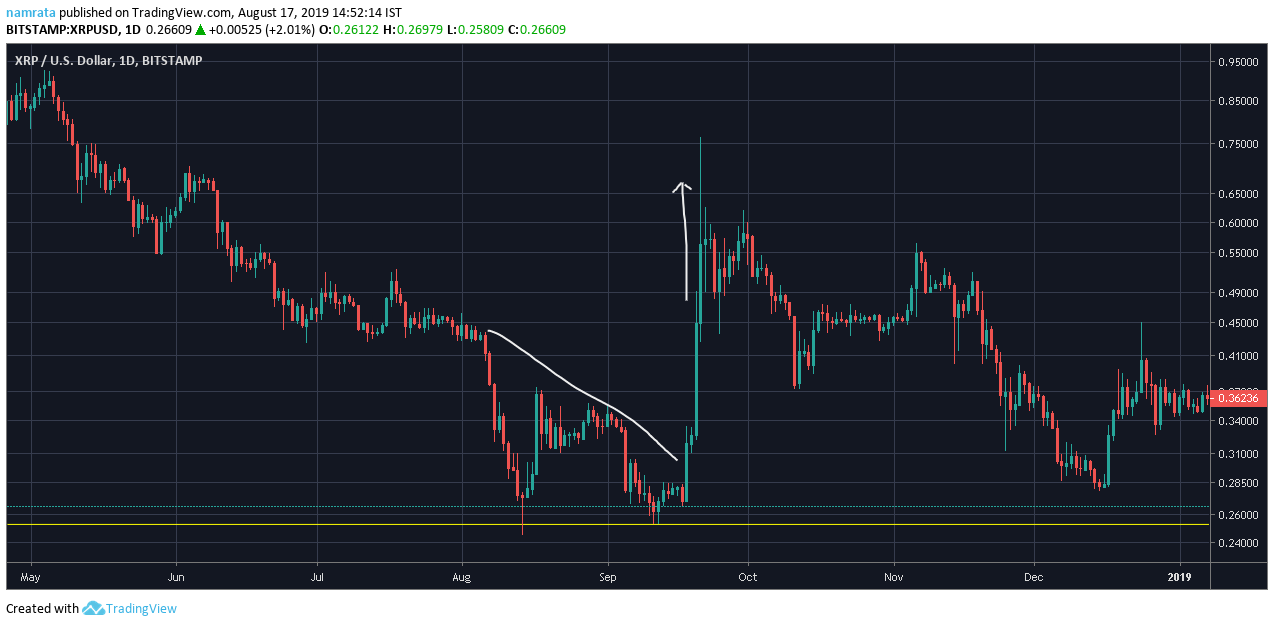
On September 2018, the price of the coin had slumped by almost 60% causing the value of the coin to slip from $0.6132 to $0.2450. The coin made a half recovery before falling further to $0.2700, while the support was marked at $0.2530. However, falling these tremendous falls, XRP bounced back hard with 184% growth taking the price of the coin to $0.7644.

Source: Trading view
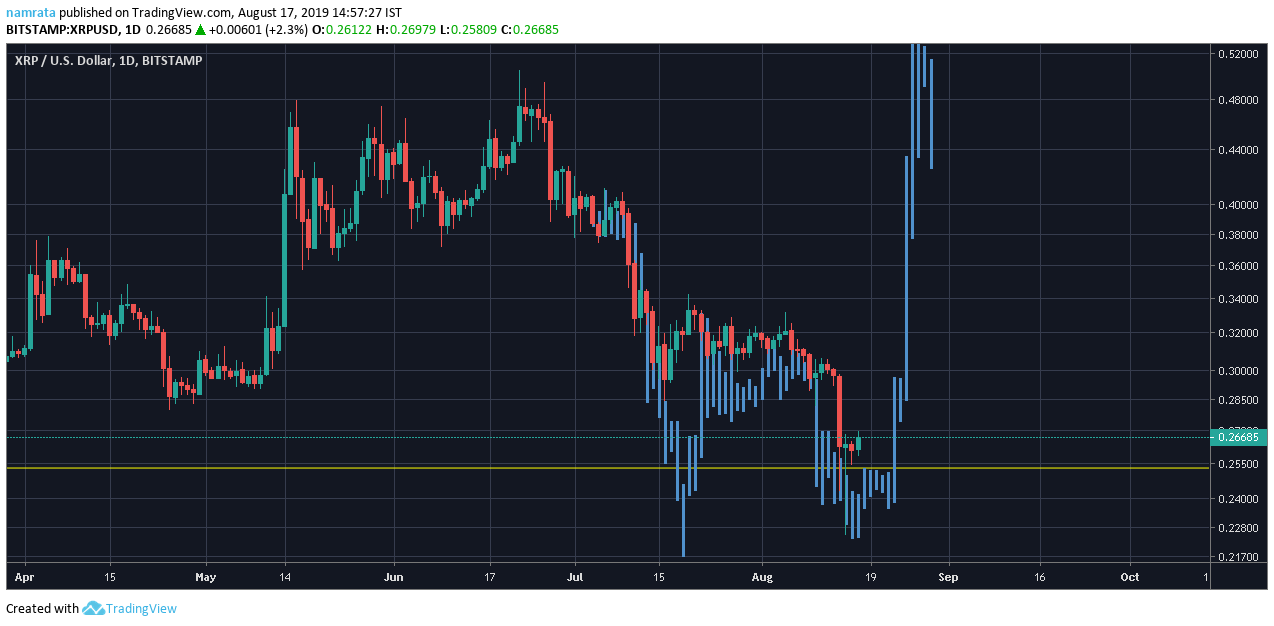
Similarly, a fractal pattern was observed with the current trend as XRP trades at $0.2661, as the support stays strong at $0.2530. The crypto has been falling for the past few days and according to Awesome OScillator has a strong bearish hold.
However, like September 2018, the trend reversal could be underway making the price of the coin cross the long term resistance at 0.4744. If the XRP price re-traces the fractal pattern to a T, its price could breach the resistance and touch $0.7644.
The post appeared first on AMBCrypto


