 Cutting through the squiggly lines of technical analysis, here are three very simple reasons why you should NOT be buying any Bitcoin in the short term. | Source: Shutterstock
Bitcoin’s recent drop below $10,000 split an already fractured cryptocurrency community into two distinct camps.
On one side are the optimists who believe Bitcoin’s drop to $9,400 is merely a blip on the way to the moon – and an excellent opportunity to buy more coins.
On the other side are those who believe the summer pump is over and more losses are due in the very near future. The squiggly lines of technical analysis can be used to back up either assertion.
So with that in mind, here are three simple indicators which strongly suggest that now is a terrible time to buy Bitcoin.
1. The Bitcoin Price’s Failure to Break Double-Top

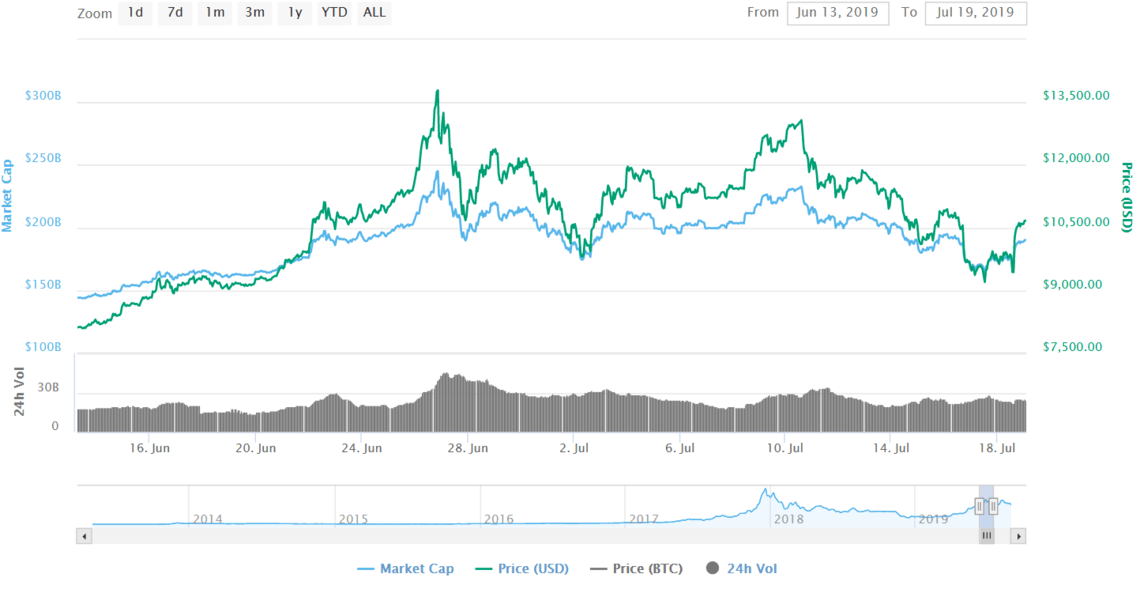
 The double-top formation posted by Bitcoin in June/July. Typically indicative of the peak of a price surge | Source: CoinMarketCap
A double-top formation refers to the twin peaks that can be seen on the charts of most traded assets when they reach the top of a price surge. Double-tops can be found all throughout Bitcoin’s ten-year history, and one came as recently as July.
When the BTC price hit $13,770 on June 26th, it was followed by a 26% drop to $9,800 – then a rapid surge back up to $13,000.
If Bitcoin had gone on to break past this double-top price point, this article would be titled in the positive rather than the negative. Instead, BTC failed to break the double-top, and for all intents and purposes, it looks like the peak has come and gone.
2. Huge Decline in Trade Volume
Another simple indicator we can look to is BTC’s rapidly shrinking trade volume. When the price peaked in late June, Bitcoin’s trade volume topped out at $45 billion, according to CoinMarketCap.

 Bitcoin is being traded at one third the volume that was being recorded two months ago | Source: CoinMarketCap
In the past 24 hours, trade volume fluctuated between $13-17 billion. Taking the midpoint, that means trades have declined 66% in just two months.
3. Bitcoin is Not as Dominant as You Think
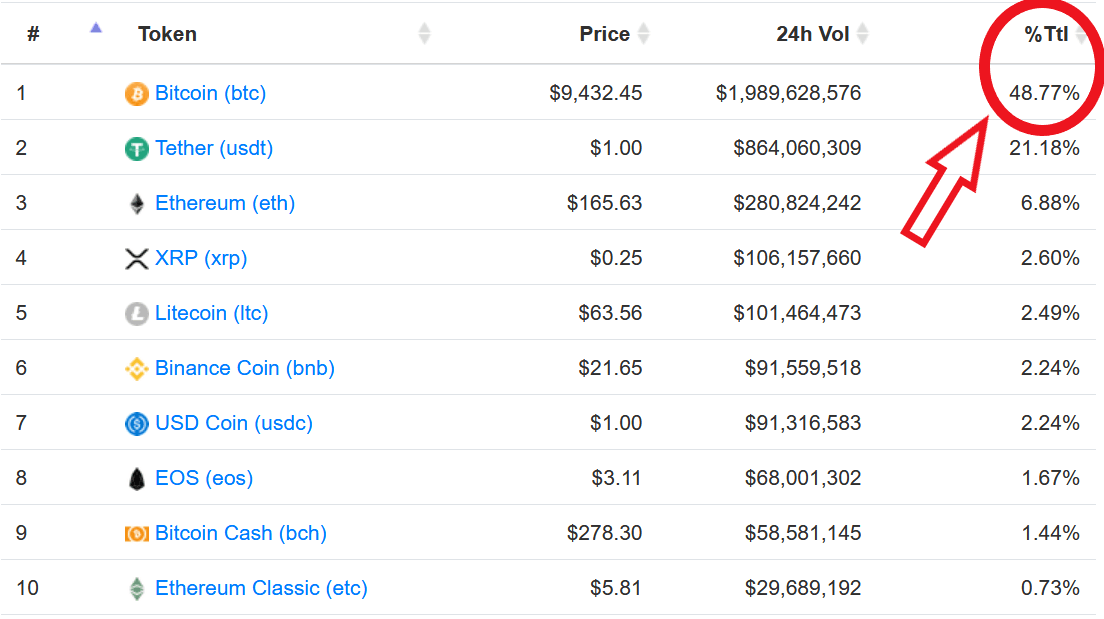
One apparently bullish indicator that’s often referenced is Bitcoin’s rising dominance. While it’s true that Bitcoin’s share of the crypto market cap is on the rise, its share of the market’s overall trading volume is significantly lower.
When we look at OpenMarketCap, which purports to pull data only from trusted exchanges, we see Bitcoin’s actual share of the daily trading market is closer to 48%.

 Real Bitcoin dominance with the wash-trading purportedly removed | Source: OpenMarketCap
The same platform showed BTC’s share of the market’s trading volume to be as low as 33% during the spring while altcoins were pumping hard.
Disclaimer: The views expressed in the article are solely those of the author and do not represent those of, nor should they be attributed to, CCN.
The post appeared first on CCN


