$1000 invested in Bitcoin on 1 January would be worth $1439, as of today. In fact, at the time of writing, Bitcoin’s price was noting 43.9% in YTD returns. Ergo, it is no surprise that it is popular as an alternative investment in asset management circles. Despite the recent drop in Bitcoin’s price below $11,500, demand is being sustained, with BTC trading closer and closer to its fair price. So, if you are rebalancing your crypto-portfolio, it is important to find answers to key questions like,
Is Bitcoin a star or a dog and, what is the average profit expectation?
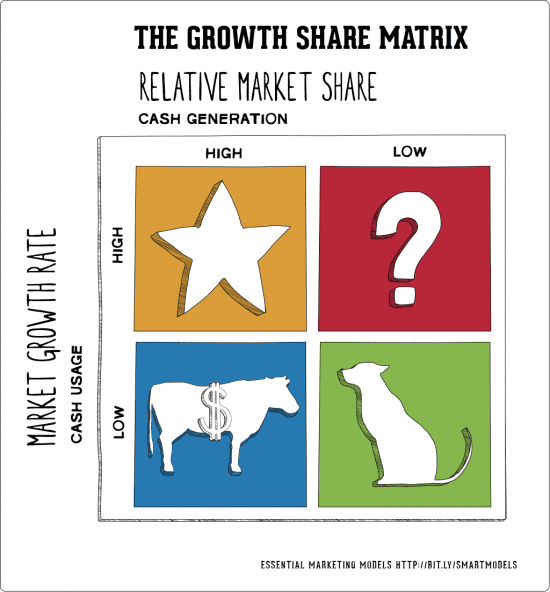
The Growth Share Matrix, devised by Bruce D. Henderson for the Boston Consulting Group in 1970, may hold the answer to the aforementioned questions. Now, the first question might sound absurd to some of you, but trust me, it isn’t, since the answers to the same will be derived from a version of this Matrix. Despite the fact that the Growth-Share Matrix is a common tool in the sector of finance, it can be used by Bitcoin traders as well.


Source: Smart Insights
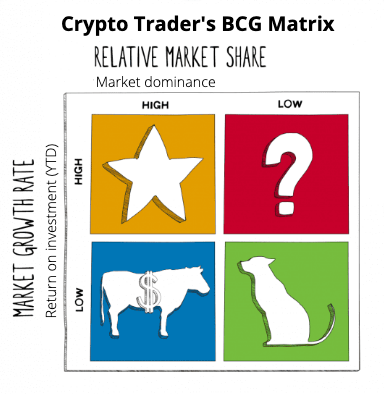
Consider this – With minor tweaks like replacing cash generation with market dominance on the y-axis and cash usage with Return on Investment (YTD) on the x-axis, a Crypto Trader’s BCG Matrix can be formulated.

The original BCG matrix associates a high growth market as potentially requiring high net cash investment. However, in this case, instead of analyzing the product based on net cash investment, the return on investment YTD will be assessed. For the same, the underlying assumption will be that Bitcoin was purchased at the start of the year on 1 January 2020 at a price of $7215.99.
The need for market share is to identify the potential income that is generated from the product. Hence, when rebalancing a portfolio, it makes complete sense to look at the products based on the market dominance of the asset. Hence, any systems on the left will be consistently profitable and, those on the right might result in losses in the short or long-term.
Now, the original matrix has animals and elements like a question mark and a Star as labels for assets. For our purposes, a fair idea of average profits and daily volume can be used when extrapolating these elements to fit in the assessment of crypto-assets like Bitcoin.
So what is a “Star?” Well, a Star is an asset that has a high daily volume and delivers high profit, as per the Crypto Trader’s BCG matrix.
Similarly, a “Dog” corresponds to low RoI and low market dominance. Now, traditionally, such a characterization would apply to an asset in its early stages, but it can also be applied to Bitcoin, although not perfectly.
Think about it – Bitcoin’s RoI, at the time of writing, was upwards of 46% YTD and its market dominance was 55.8%. Those are both good numbers, but what these numbers don’t reveal is the fact that these figures have dropped considerably over the past few months. Market dominance, for instance, has dropped from 68% in January 2020, while the RoI was much higher when Bitcoin was knocking on the door of the $12,000-mark. Even if we account for the fact that RoIs keep changing, we’ll have to account for the market dominance slipping so badly, an observation that would characterize an asset like Bitcoin as a “Question Mark.”
When other crypto-assets like Ethereum’s DeFi projects and popular altcoins are assessed, there may be potential options with higher YTD. However, they do not match Bitcoin’s market dominance. Four months post the Bitcoin halving, we are now in the accumulation phase of the market cycle, and this is unlikely to change for the time being.
Bitcoin right now, ergo, is well-positioned to be characterized as a “Star,” with high market dominance and high RoI. However, as we’ve established, characterizations change, even when they are assessed under tried-and-tested matrixes like the BCG’s.
Circling back to the two key questions highlighted above, we can see that Bitcoin, for now, is a “Star” in this phase of the market cycle and the average profit expectation is high, relative to other assets in one’s portfolio (The keyword being relative). On comparing the average profit to other phases of the cycle, however, it can do better.
The post appeared first on AMBCrypto


