Despite the fact that Binance Coin was highlighted as being undervalued in a recent report, BNB was trending strongly upwards, at the time of writing. On the contrary, EOS lacked momentum in either direction, as was the case with Compound.
Binance Coin [BNB]


Source: BNB/USDT on TradingView
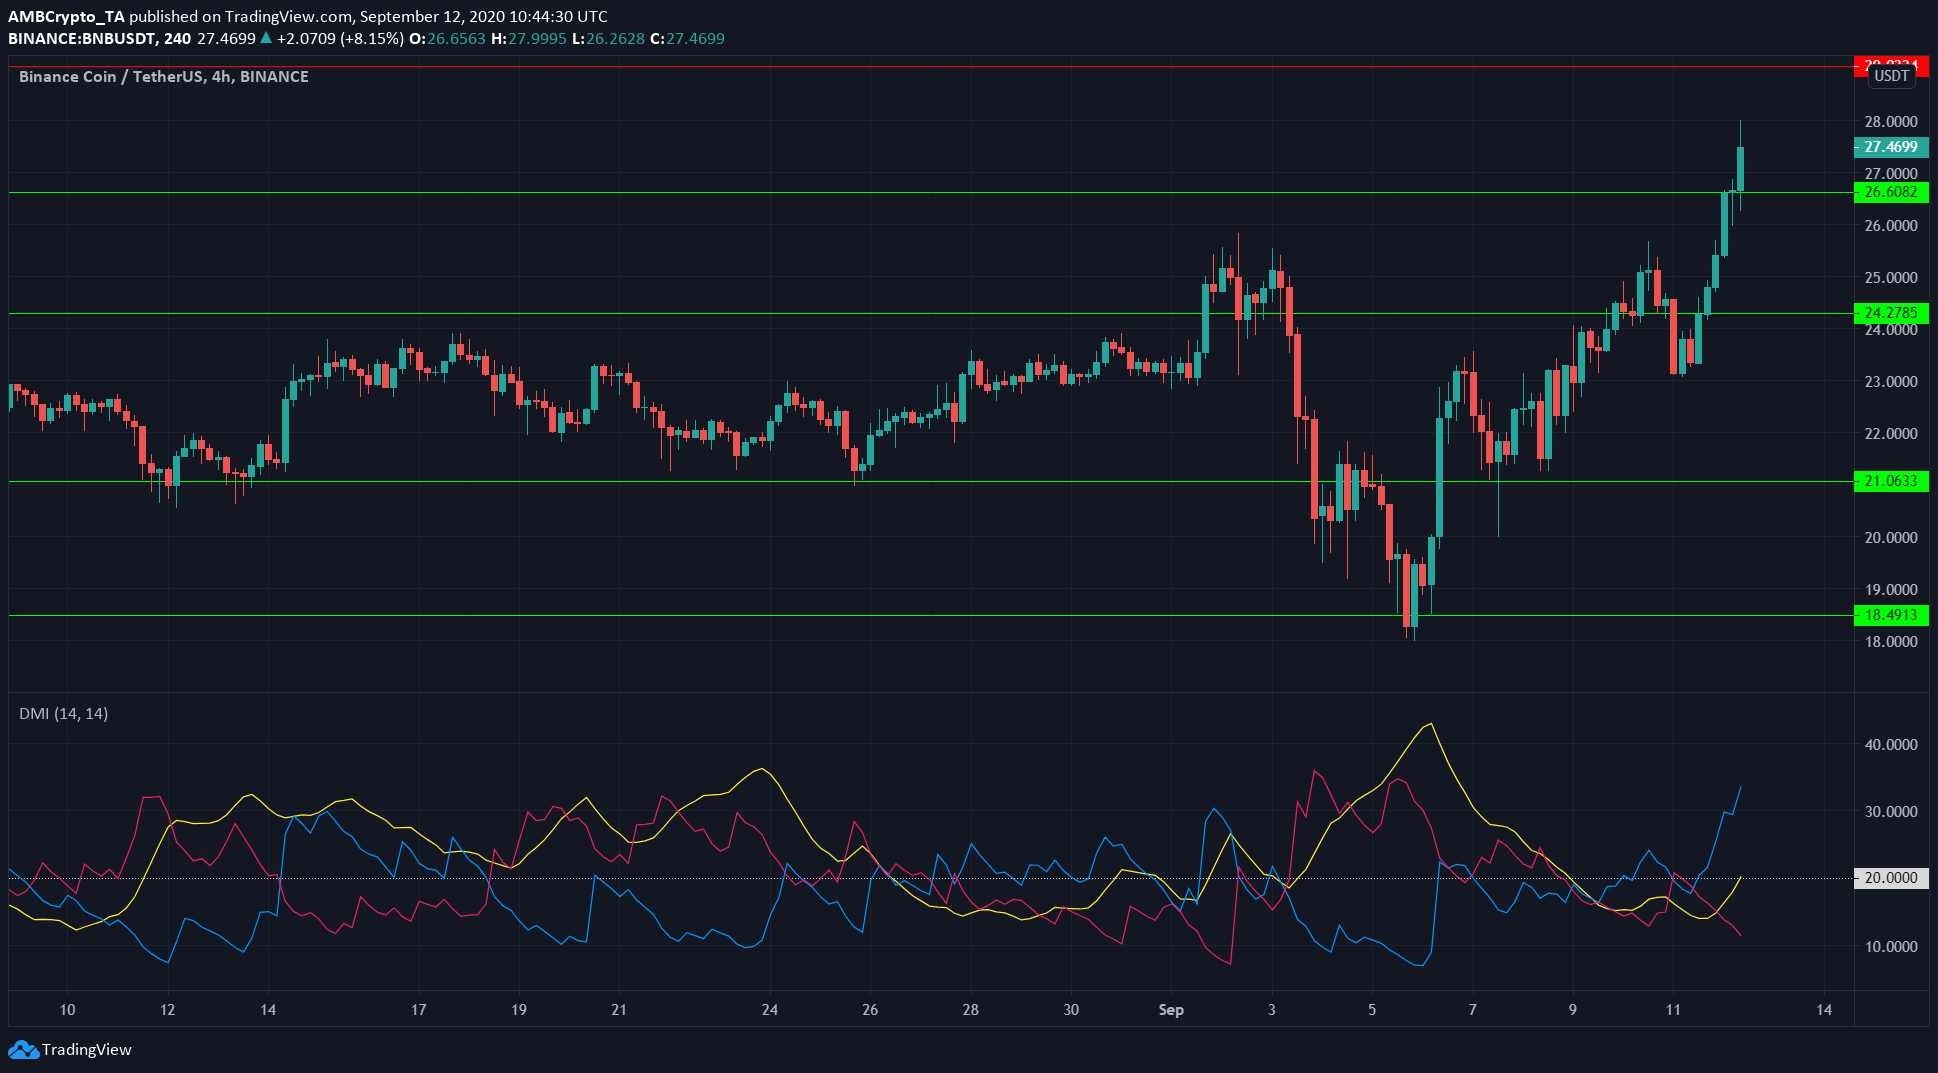
Binance Coin had resumed the strong uptrend it exhibited before the drop in early-September, at press time. In fact, it surged past the resistance levels at $24.3 and $26.6. However, BNB might drop to re-test the support at $27, before eyeing the next level of resistance.
The Directional Movement Index showed the beginning of a strong uptrend as the ADX (yellow) was on the verge of climbing past 20, a value traders use to separate strong trends from weaker ones. The +DMI (blue) was also soaring, a sign of the trend being bullish.
In fact, BNB had reached the same resistance level at $26.6, earlier this year, in February. A weekly close above this level would be strongly bullish for the coin in the long-term as it would represent a yearly high.
EOS


Source: EOS/USD on TradingView
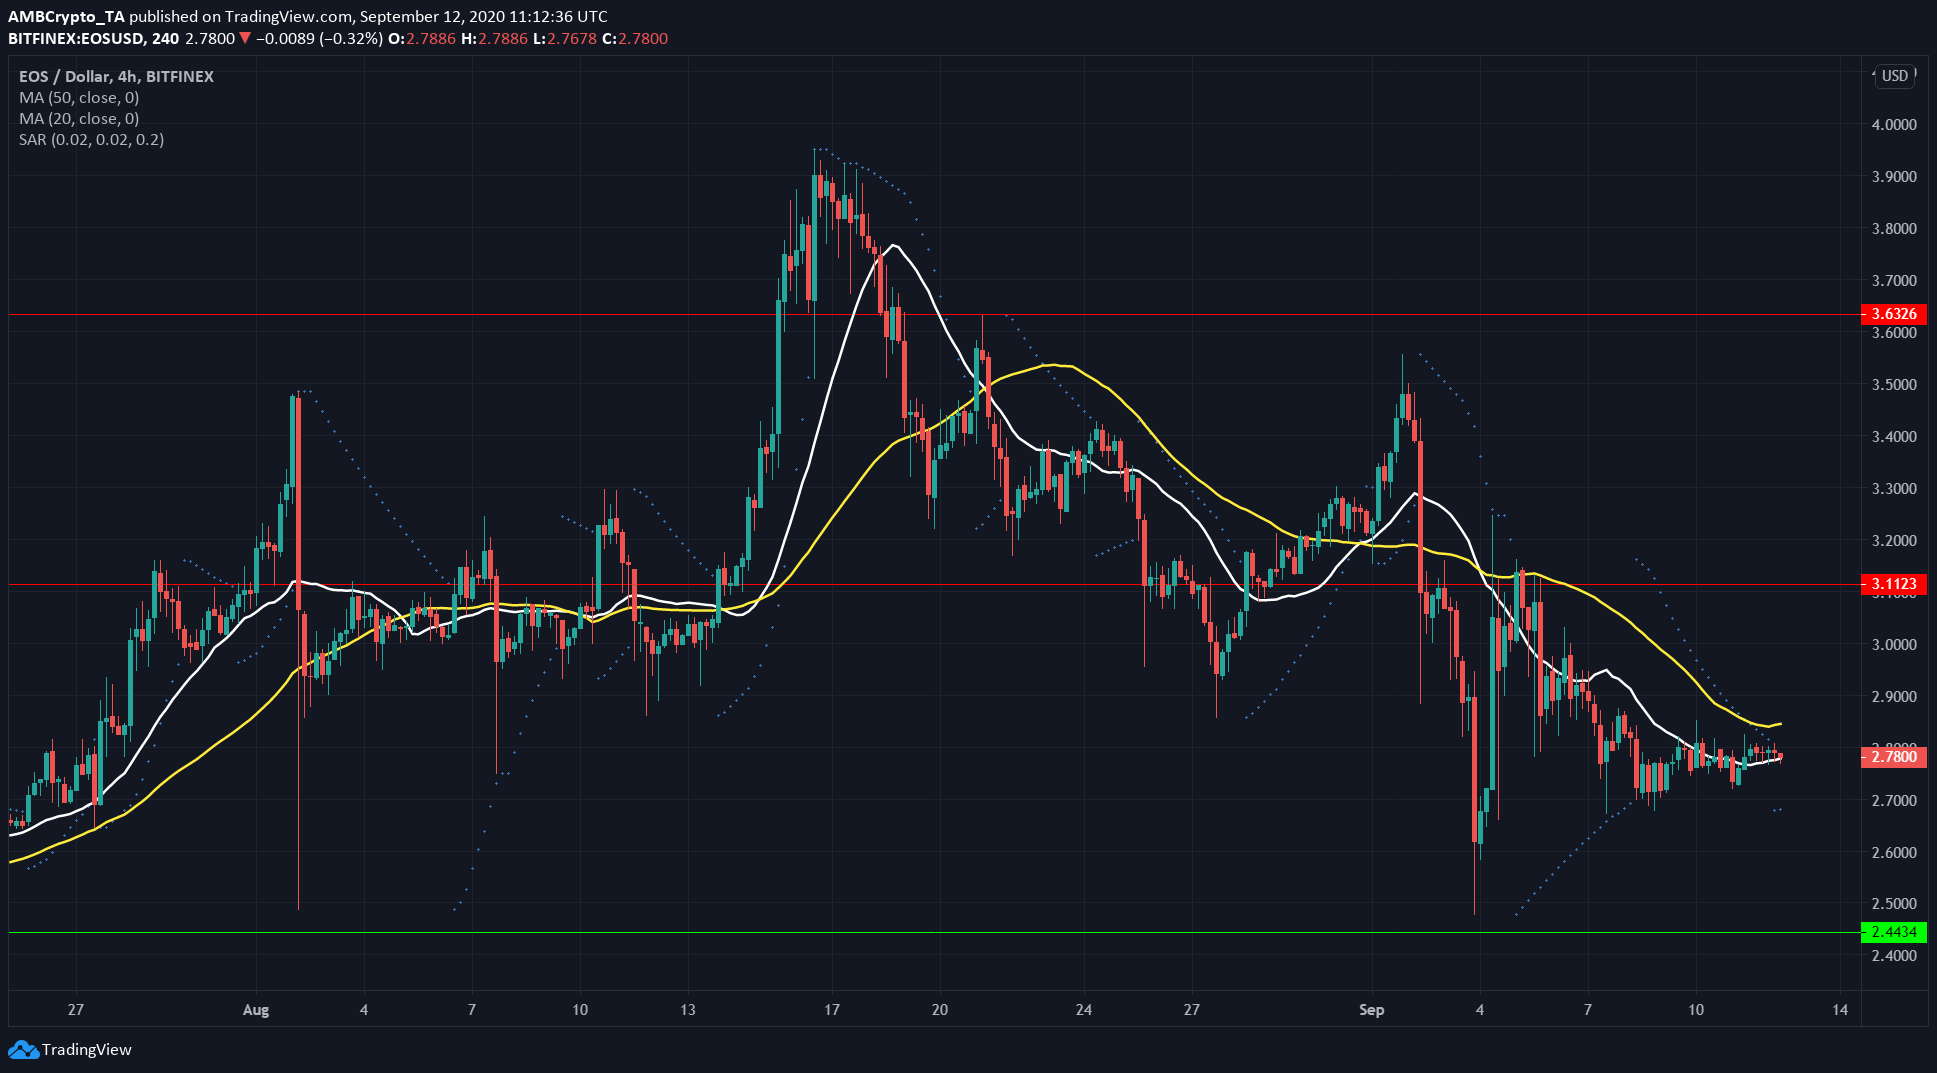
EOS was trading in between the 20 SMA (white) and the 50 SMA (yellow), with either level expected to act as support and resistance, respectively, in the short-term.
However, the 20 SMA was beneath the 50 SMA, signalling that EOS has been trending downwards recently.
The Parabolic SAR gave a buy signal, but EOS would need to move past the 50 SMA to give a definite clue of its next direction.
The overhead resistance lay at the $3.1-level, while a significant level of support lay around $2.44.
Compound [COMP]


Source: COMP/USDT on TradingView
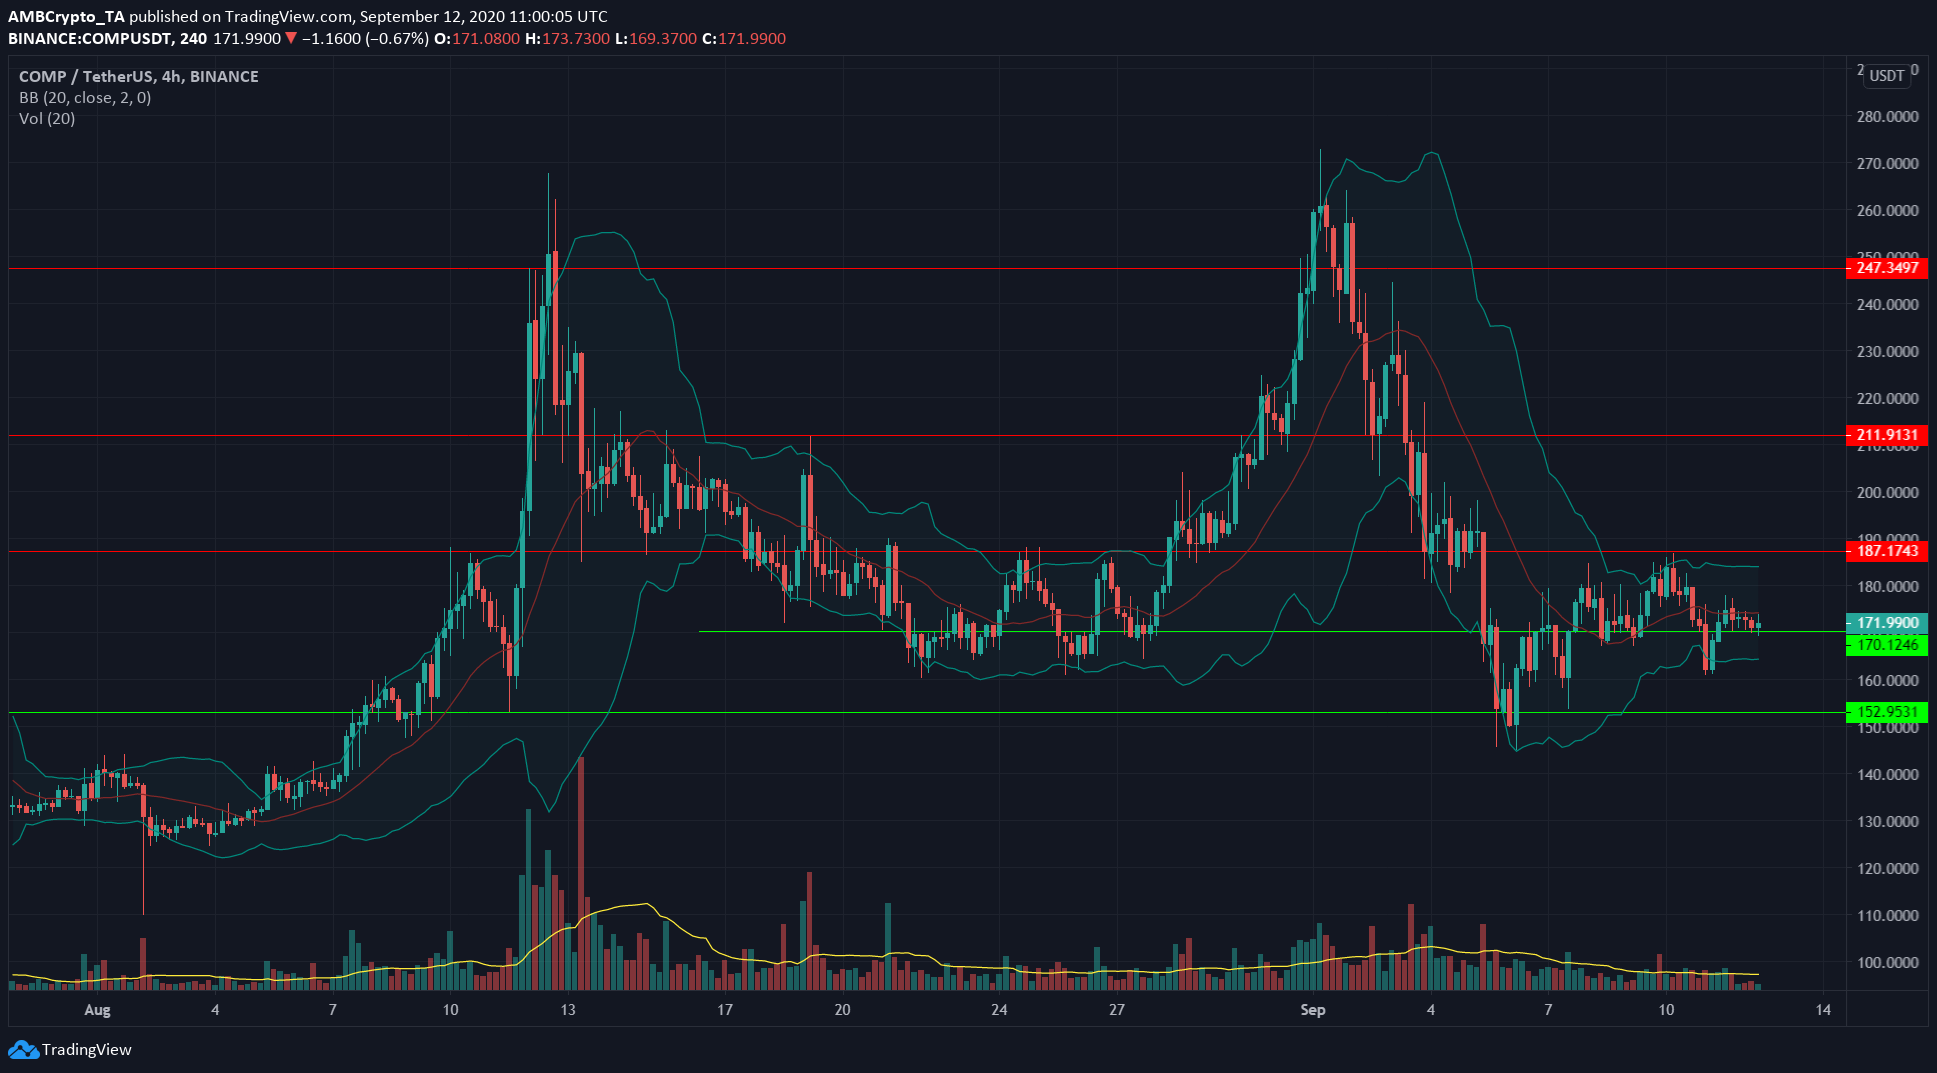
COMP was trading at $171.99, at press time, and above the $168 level which had recently served as its support.
The Bollinger Bands showed that volatility was very minimal, as the mouth of the bands had converged around price. A few days had passed since the squeeze set it, and it might continue into the weekend. Trading volume was also very low for the past few trading sessions.
The prrice within the bands moving toward the upper or lower band, accompanied by a widening mouth of the Bollinger bands, would indicate the direction of the next COMP move.
The post appeared first on AMBCrypto


