Disclaimer: The findings of the following article ar the sole opinion of the writer and should not be taken as investment advice
Binance coin is perhaps among the few exchange tokens that are not just alive, but kicking too. Plenty of exchange tokens are on the market today, but none holds as much promise as BNB.
While there are many aspects to the exchange token, this article will concentrate mostly on the price of Binance Coin.
A brief look at Binance Coin and its past
Unfortunately for BNB, the coin was merely a newborn when the 2017 bull run was taking over cryptocurrencies. Regardless, the coin hit a high of ~$2.8 in 2017. However, it hit a new high [of $22.8] during 2019’s brief rally, which was 8x its previous high, in just ~140 days.
With its exclusive on-chain utilities, own blockchain, host applications, and an ecosystem built on top of it, Binance Coin’s fundamentals are bullish, to say the least. However, its price took a jab at outdoing its ATH and that is what this article is about.
Binance 1-day chart


Source: BNBUSD on TradingView
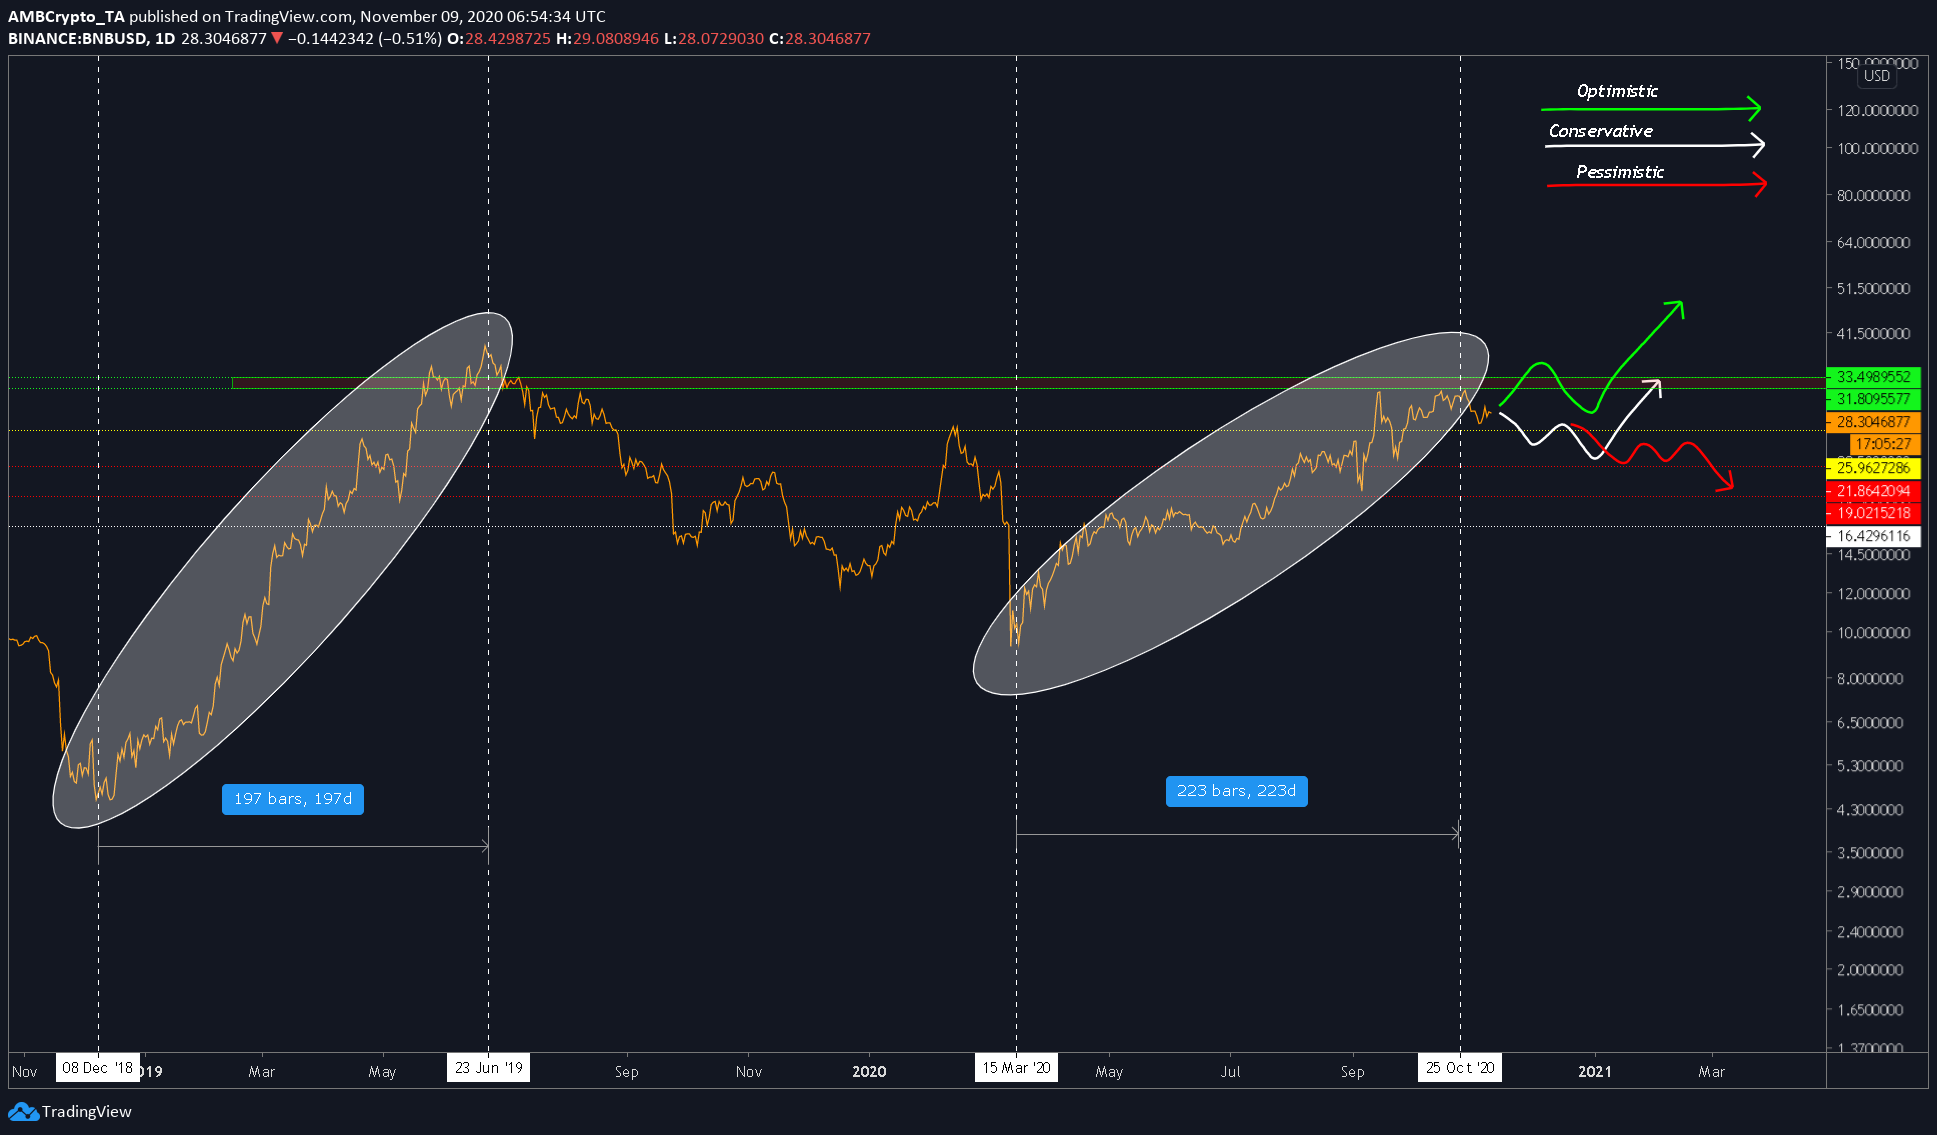
Binance Coin’s one-day chart highlights the run leading up to the high of 2019 and the current rally, while also underlining how strikingly similar they are. The 2019 rally lasted approximately 200 days, while the present rally is at 223 days now.
During the 223 days that BNB has spent rallying, we have seen it come very close to its 2019 highs. In fact, BNB was 21% away from the top on 14 September, the peak of the DeFi hype. However, twice, it has failed to break past a zone of resistance [green rectangle] ranging from $33.49 to $31.80.
Multiple realities?
Due to the similarity between these two rallies, if this rally fails to breach, there are 3 possibilities we might encounter – an overly optimistic scenario, a bearish one, and a conservative scenario.
The optimistic scenario is for BNB to break out of the aforementioned resistance zone and hit new highs. This is not possible unless we see a FOMO surge in Bitcoin. Even then, altcoins will suffer depending on existing/new capital flows from alts to Bitcoin. The other way this will happen is if Binance announces something big that takes the ecosystem by surprise.
The bearish scenario is simple – It just follows the post-2019 rally’s footsteps while the bulls slumber out of exhaustion. This will push the price down to its first support at $25.96. Following a breach of this, the price of BNB will depreciate to $21.86 and in the worst-case scenario, head down to $19.02.
There are many factors that can contribute to this happening – A hack on its parent exchange, a lawsuit on Binance, and a buggy smart contract on its DeFi platform are just some of them. Or, it could just be the continuation of the Bitcoin rally, in which case, the price will hit the first and perhaps, the second support.
The conservative scenario is that the price accumulates/distributes by moving sideways, following which, it taps the support at $25.96, before surging higher on the charts.
The post appeared first on AMBCrypto


