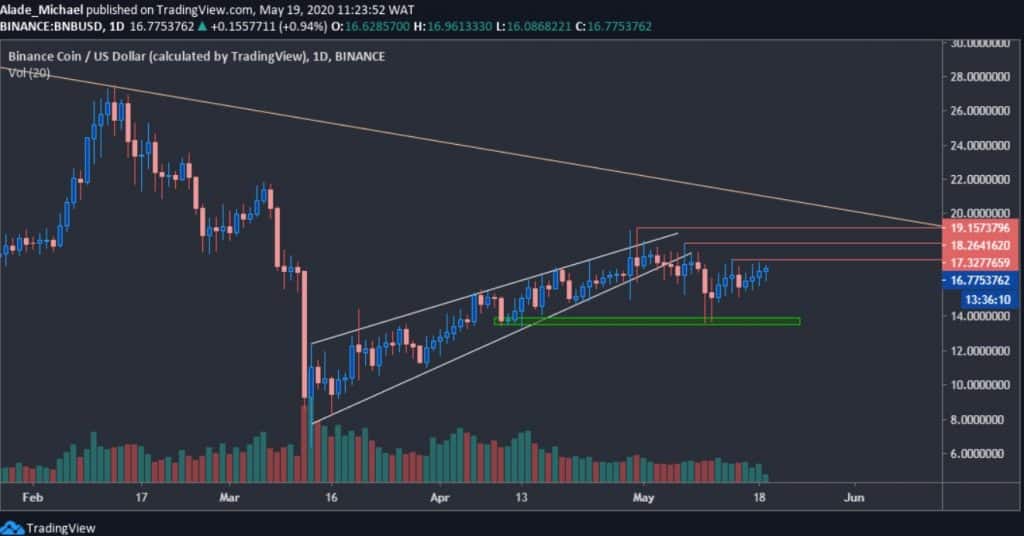
- Following a quick bounce from $13.6, BNB is now facing a crucial resistance at $17.3.
- The price is currently in the middle of consolidation, deciding the next major direction.
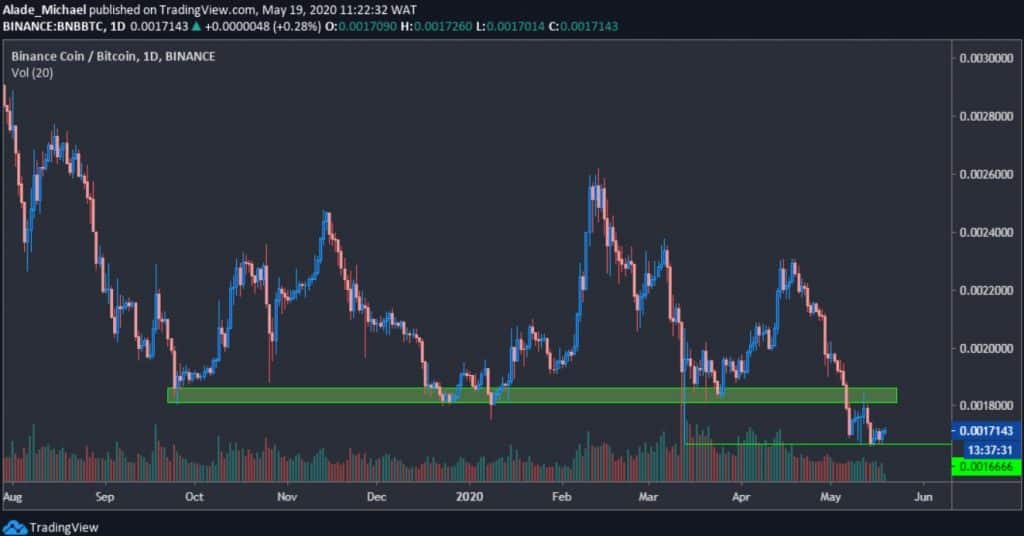
- Binance Coin is looking for more gains after dropping below long-term support at 0.0018 BTC level.
BNB/USD: BNB Building Up For A Big Move
Key Resistance Levels: $17.3, 18.26, $19.1
Key Support Levels: $15, $13.6, $12

Binance Coin and some major altcoins have seen a lot of build-ups (consolidation mode) since the Bitcoin halving took place. The 8th most-traded cryptocurrency has technically remained indecisive for almost a week now.
The wedge breakdown to $13.7 9 (marked green on the daily chart) is worth paying attention to as well as BNB could undergo more correction if the $17 .3 resistance continues to hold firm. Another thing here is the current volatility contraction, which indicates a big wave is around the corner.
The bulls are trying as much as possible to sustain pressure and to remain in control following the recent bounce back. A clear break above the orange descending (forming since June 2019) would signal a green light for long-term gains.
Binance Price Analysis
Binance Coin is still up by 3%, with a current trading price of $16.9 against the US Dollar. The first level to watch for break out is $17.3 resistance, followed by $18.26. The last level to watch is $19.1 resistance, all marked red on the daily chart.
Once these resistance levels break, BNB might start a big move upwards.
Towards the downside, Binance Coin is currently holding support above $15, but the major support here is around the green demand area of $13.6, where the price recovered from on May 10. Support below this area lies at $12.
BNB/BTC: BNB Stays Calm After Breaking 8-month Support
Key Resistance Levels: 0.00184 BTC, 0.0020 BTC, 0.0023 BTC
Key Support Levels: 0.001666 BTC, 0.0015 BTC, 0.0014 BTC

Since our previous price analysis, Binance Coin saw a slight drop to 0.001666 BTC level after breaking down from 8-month support at 0.0018 BTC, which is now acting as resistance for the market. The price is currently trading around 0.00173 BTC, up 1%.
On the daily chart, BNB held the 0.001666 BTC level as support for the past five days now as the volatility subdues with choppy price actions.
A decrease below this mentioned level could result in more losses. However, it may recover back if the price can increase above the green supply area. But considering the breakdown, there’s a high chance for loss than recovery.
Binance Coin Price Analysis
While holding above 0.001666 BTC at the moment, a steep drop could floor the price straight to around 0.0015 BTC or even 0.0014 BTC levels in the next selling pressure.
If the BNB/BTC pair successfully bounces back from the immediate key support level, the price could retest the green supply area of 0.00184 BTC once more. An increase above this area should rekindle bulls’ hope again.
By then, buyers would target the 0.0020 BTC and 0.0023 BTC levels as soon as they regroup. But as it appeared now, the sellers are much likely to pull the price below the current holding support.
The post Binance Coin Price Analysis: BNB Facing $17 Resistance But Shows Weakness Against Bitcoin appeared first on CryptoPotato.
The post appeared first on CryptoPotato


