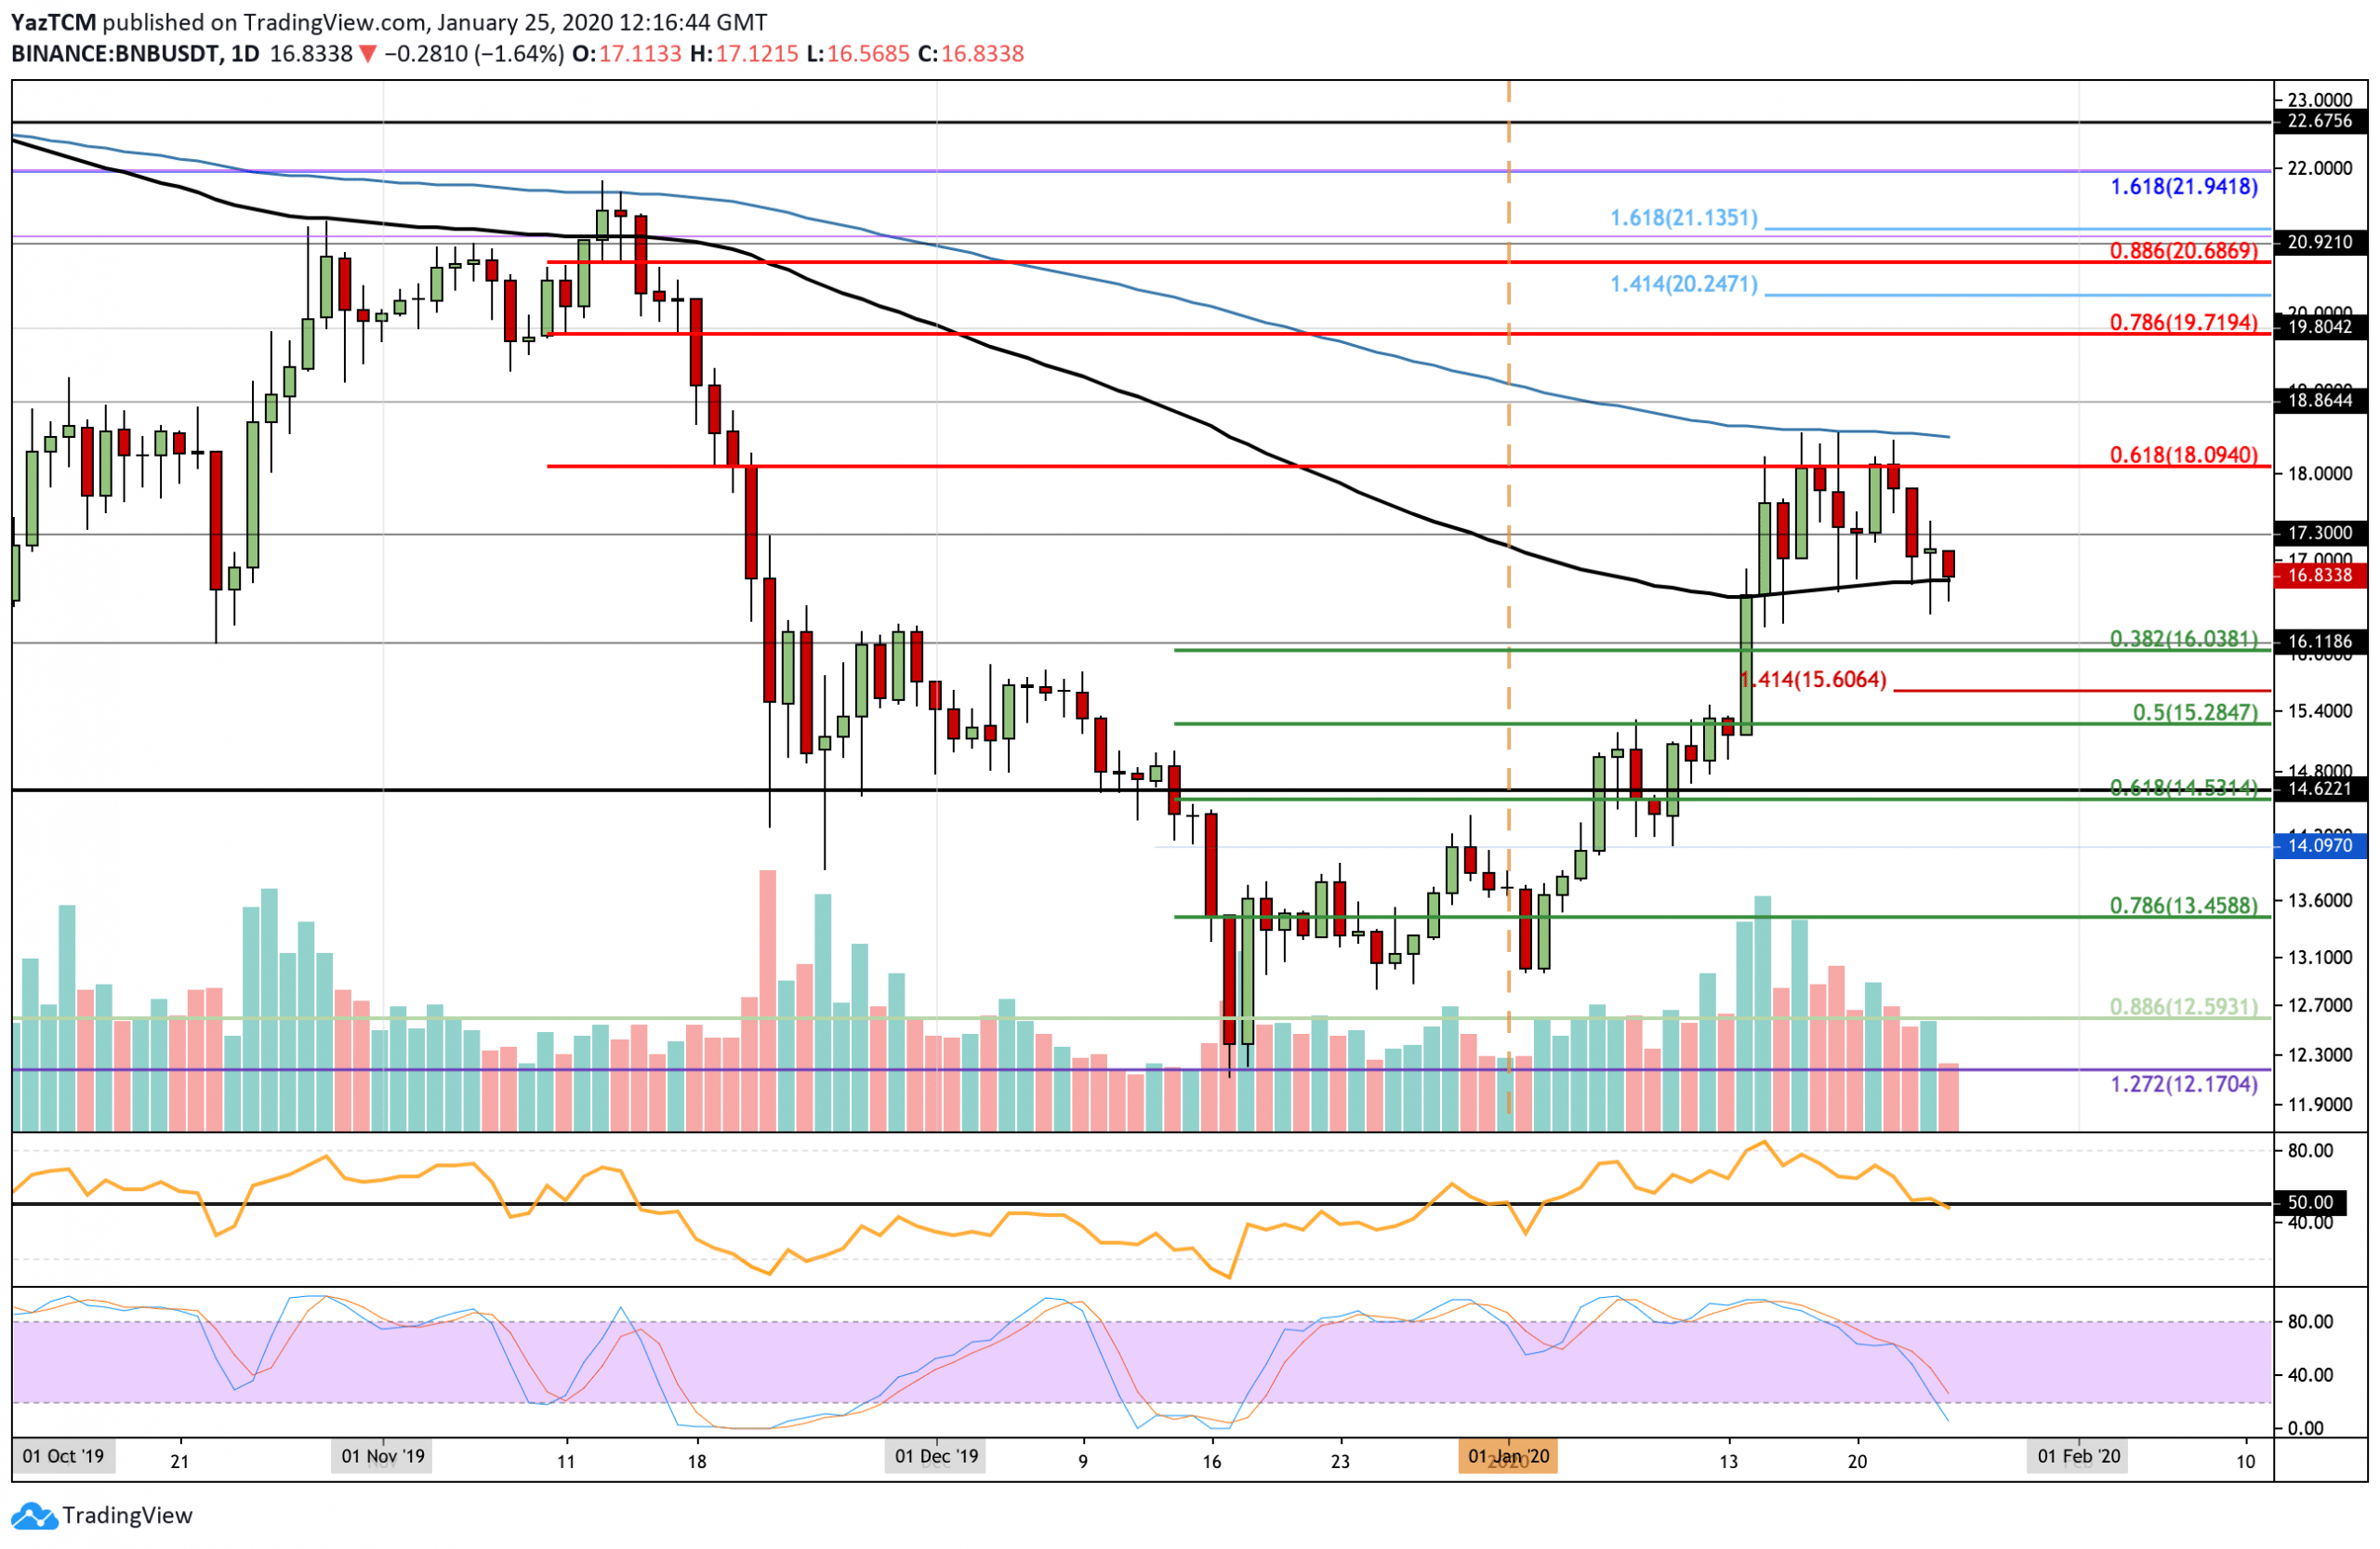
- Binance Coin has seen an impressive 27.5% price hike this month, bringing it up to $16.83
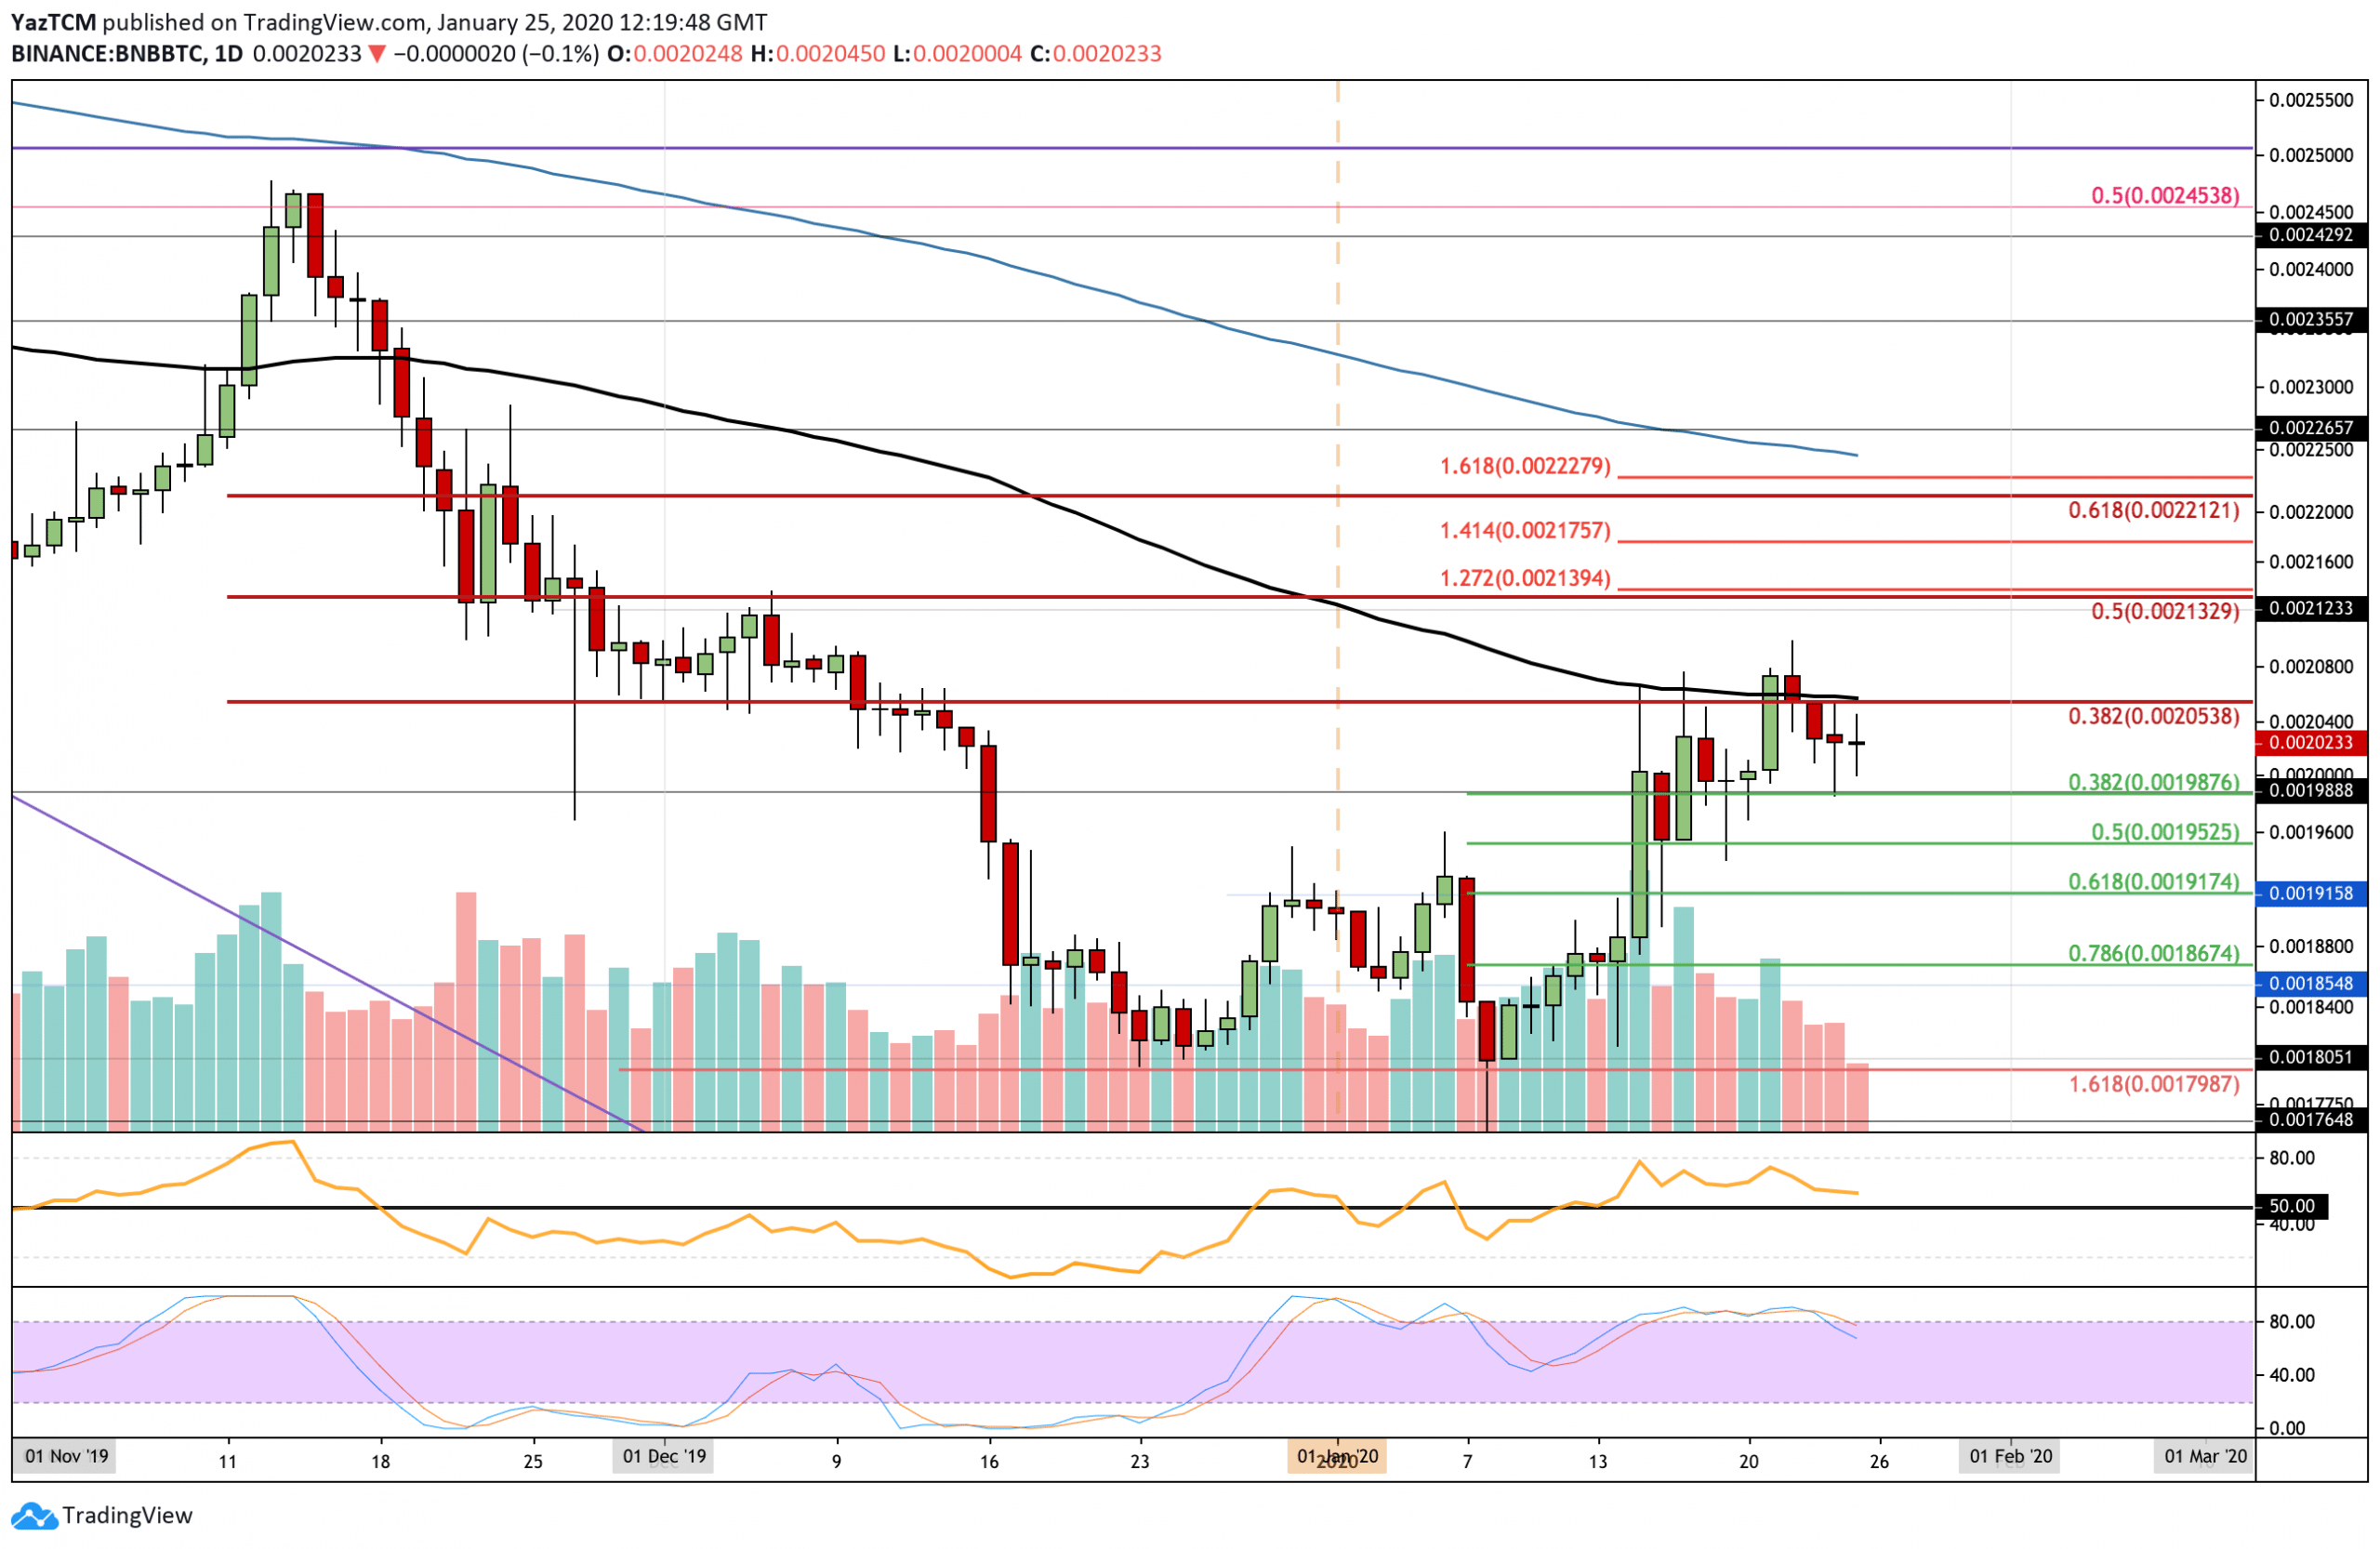
- Against BTC, BNB rebounded from support at 0.00179 BTC at the start of 2020 to climb to the current 0.002 BTC level.
- Binance Coin has dropped a small 5% this week after meeting resistance at the 100-days EMA and rolling over.
Key Support & Resistance Levels
Support: $16.80, $16.00, $15.60, $15.28.
Resistance:$17.30, $18.09, $18.50, $19.71.
BNB/BTC:
Support: 0.00198 BTC, 0.00195 BTC, 0.00191 BTC.
Resistance: 0.00205 BTC, 0.00213 BTC 0.00217 BTC.
BNB/USD – Binance Coin Resting At 100-Days Support – Will The Bulls Keep Us Above?

Binance Coin started 2020 off with a strong 42% price surge as it increased from $13 to reach resistance provided by the 200-days EMA at $18.50. Since then, BNB has rolled over and started to fall. It dropped into support at the 100-days EMA at around $16.80 as the bull’s battle to defend the area.
Binance Coin remains in a bullish trend at this moment after breaking above the December highs at $15.90. However, if it falls beneath the current support at the 100-days EMA, it will turn into a neutral trend. To turn bearish, BNB must drop further lower and break beneath the support at $14.50.
Binance Coin Short Term Price Prediction
If the bulls manage to defend $16.80 and bounce higher, an initial resistance is expected at $18.09, which is provided by a bearish .618 Fibonacci Retracement level. Above this, resistance is located at $18.50 (200-days EMA), $19, and $19.71 (bearish .786 Fibonacci Retracement level). On the other hand, if the sellers break beneath the 100-days EMA, support is expected at $16 (short term .382 Fib Retracement). Beneath this, support lies at $15.60 (downside 1.414 Fib Extension), $15.28, and $14.53 (short term .618 Fibonacci Retracement level).
The RSI has poked beneath the 50 level, which is a worrying signal if it continues to fall further as the sellers take over the market momentum. The Stochastic RSI is showing promise as it approaches extreme oversold conditions, which is a sign that the selling pressure could be starting to show the first signs of fading.
BNB/BTC – Binance Coin Drops Back Toward 0.002 BTC – Will We Break Beneath?

Against Bitcoin, BNB started the year in a pretty solemn manner as it dropped toward the support at 0.00179 BTC. More specifically, BNB dipped to as low as 0.00175 BTC before bouncing higher. Nevertheless, BNB did manage to rebound and began to surge by a total of 19.6% throughout the month to reach a high of 0.0021 BTC. Resistance here is provided by the 100-days EMA and a bearish .382 Fibonacci Retracement level, which caused the market to roll over.
BNB is currently within a neutral trend against Bitcoin as it as started to make higher highs but remains beneath the December highs at 0.00213 BTC. To turn bullish, BNB must break above this resistance. If BNB were to fall back beneath 0.00191 BTC, then the market would be considered as bearish.
Binance Coin Short Term Price Prediction
If the sellers push BNB beneath 0.002 BTC, support can be expected at 0.00198 BTC (.382 Fib Retracement). Beneath this, support lies at 0.00195 BTC (.5 Fib Retracement), 0.00191 BTC (.618 Fib Retracement), and 0.00188 BTC. Alternatively, if the bulls can defend the support at 0.002 BTC and rebound higher, strong resistance lies at 0.00205 BTC. Above this, additional resistance lies at 0.00213 BTC (bearish .5 Fib Retracement), 0.0217 BTC (1.414 Fib Extension), and 0.0022 BTC (bearish .618 Fib Retracement).
The RSI is approaching the 50 level, which shows that the previous buying momentum is fading. If the RSI does drop beneath 50, then BNB is likely to fall toward 0.00191 BTC. Furthermore, the Stochastic RSI recently produced a bearish crossover signal in overbought conditions, further adding to the selling signals.
Disclaimer: Information found on CryptoPotato is those of writers quoted. It does not represent the opinions of CryptoPotato on whether to buy, sell, or hold any investments. You are advised to conduct your own research before making any investment decisions. Use provided information at your own risk. See Disclaimer for more information.
Cryptocurrency charts by TradingView.
Technical analysis tools by Coinigy.
The post appeared first on CryptoPotato


