As the collective digital asset industry stepped into Q4 2020 with a bearish tune, Binance Coin suffered quite a significant drop. With the price consolidating near $30 on 30th September, a quick turnaround led to a decline to $25.8. While over the past few hours, BNB has bounced back to $26.46, the volatility in the space remains extremely high.
Binance Coin’s market cap had dropped down below $4 billion after the recent collapse.
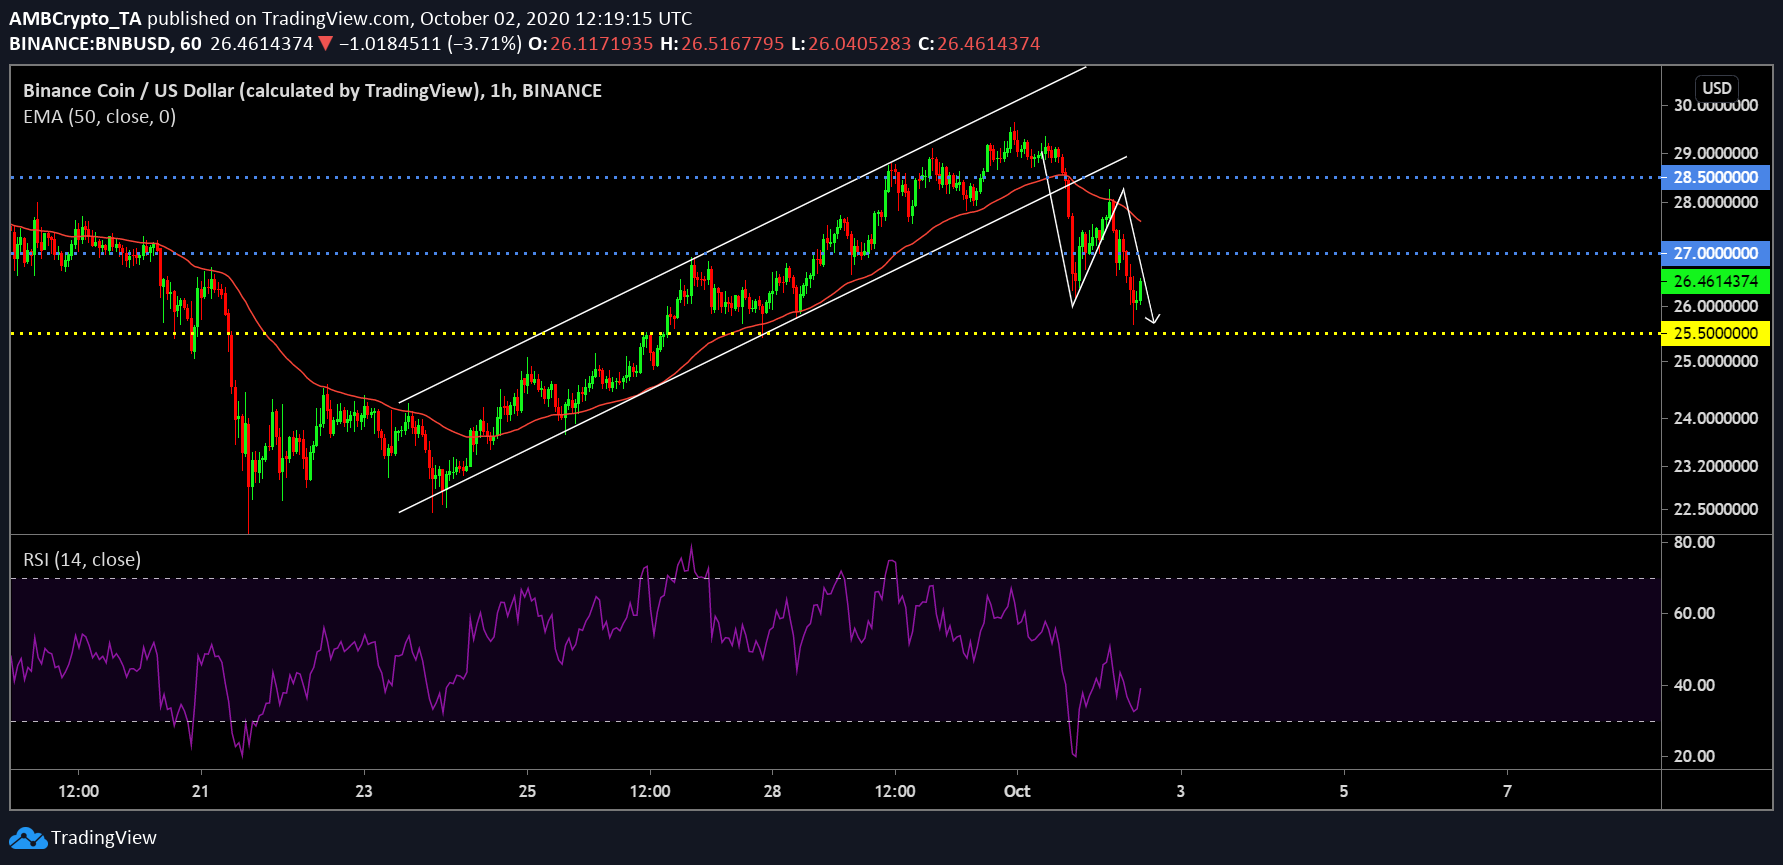
Binance Coin 1-hour chart
While many claimed that the drop was unexpected, the correction appeared timely on the 1-hour chart. Following on a strong ascending channel for 6-days straight, the breakout on 1st October is a classic bearish drop from the pattern. While the price was pull down to $25-$26 range twice, BNB seemed on the path to recovery at the moment.
Relative Strength Index or RSI was rapidly dragged to an over-sold position due to a heavy sell-off period but over the past 24-hours, the buying pressure is balancing the books with a recovery.
While 50-Exponential Moving Average is currently suggestive of strong overhead resistance, there is a possibility for Binance Coin to retain a position near $28-$29 however, the narrative may flip as well.
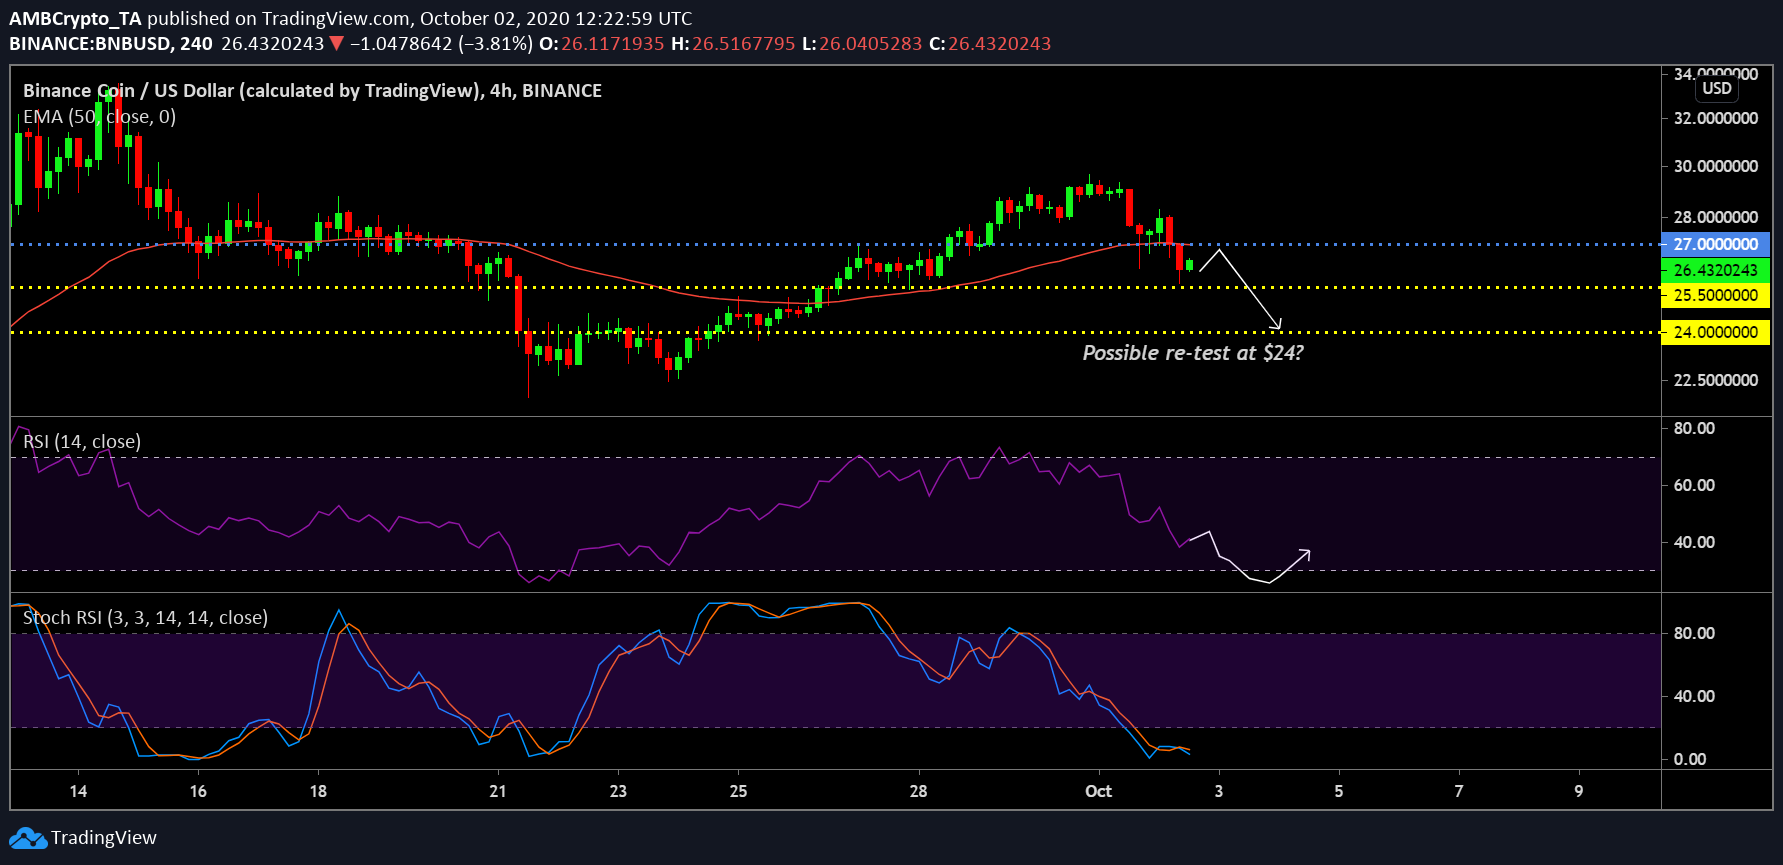
Binance Coin 4-hour chart
Now, considering that the volatility extends with the remaining bearish momentum, there is a likely scenario that the price may drop below the support of $25.5. After the mentioned support, the next line comes in at $24 which is also a distinct possibility due to the expressive-ness of the Relative Strength Index. RSI may suggest a little recovery at the moment but it can easily turn into another round of bloodbath with a strong move coming through after visiting the over-sold position.
While Stochastic RSI suggested a move upwards is imminent as we speak, past performance has suggested another pullback after a minor move above. With Binance Coin, it is like flipping a coin at the moment with the probability of both bearish and bullish split even.
The post appeared first on AMBCrypto


