Unlike a Bitcoin proponent, Gold bugs never say ‘you should’ve bought the gold dip.’ Have you ever wondered why?
The immediate answer would be Bitcoin is volatile, it’s up today, down tomorrow. On some days, it’s down by 50 percent or more, those are days when you should’ve bought the dip. On the other hand, gold is not volatile, it’s meant to be stable and give you and your portfolio some safety. Isn’t that right?
While this is true, gold is having one of its most volatile years, with a year-to-day maximum deviation between peak to trough (PTT) at $571.4. Bitcoin’s deviation is 12.3 times that, at just over $7,000. That seems like a lot, right? But, in fact, when expressed against each asset’s yearly price, you’d be surprised which asset had the worst drawdown.
Let’s put the two numbers up front – Bitcoin saw a PTT difference of $7,047 and gold at $571, which means that Bitcoin’s price difference from its high to its low was 12.3 times gold’s price difference. Now that this has been established, let’s dive deeper.
Bitcoin’s average trading price on a daily scale was $9,196 and gold’s was $1,737. The drawdown for Bitcoin constituted 76.7 percent of its average price.


Source: Coinstats
On the contrary, gold’s drawdown was less than half at 32.8 percent of its price. Again, gold’s drop seemed to take less away from its price, right?
The cryptocurrency’s PTT difference showed less volatility at the beginning of the year, mainly because it began the year at roughly close to $7,000, while gold was $200 cheaper at $1,540. As the year went on, Bitcoin deviated away from this PTT difference and gold stayed closer, as you’d expect.
But, while Bitcoin’s price swayed and gold’s price was stable, the difference against this drawdown was more for the commodity than the cryptocurrency. Why? Because gold’s rise and fall were concentrated, with the trough in March, with all the other lows, and the peak in August, with all the other highs. What this did is it created a high difference for gold’s annual trading price which was so huge that the periods without highs and lows deviated at high levels against the PTT difference.
This wasn’t the case for Bitcoin.
While Bitcoin’s deviation was significantly higher than gold’s, the crypto’s highs and lows were scattered, especially the highs. Breaking $10,000 on two occasions before its March drop and rising steadily since meant that its PTT was fairly representative of its price, unlike’s gold’s which was wayward compared to its more stable price throughout the year, if you leave aside the highs and lows.
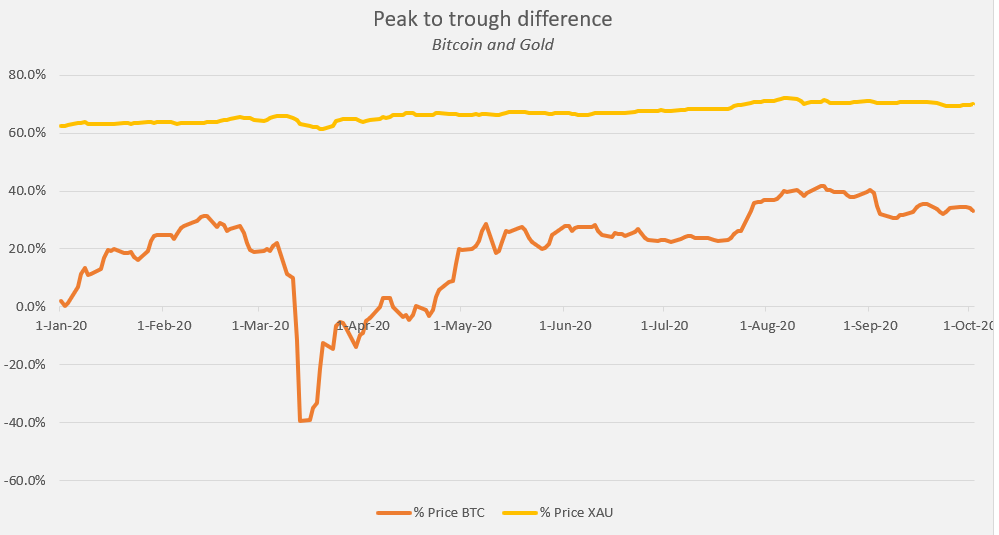
So, what did this do? The PTT difference, against each day’s trading price, meant that gold’s difference was way more than Bitcoin’s. When expressed as a percentage of the asset’s price for every day of the year, this is what they look like.

Yes, Bitcoin’s price is significantly more volatile than gold’s once again, that even I cannot deny, but what’s important here is that Bitcoin’s PTT difference is below gold’s.
While gold averages 66.9 percent deviation against its current trading price, Bitcoin averages just 20.7 percent. Again, what does this mean? This means that gold’s highs and lows were so far removed from its actual price that its high to low difference took a lot away from its daily trading price.
In Bitcoin’s case, the opposite is true, the cryptocurrency’s high to low difference was more representative of its trading price, and it not only closely tracked its daily price, but the difference was lower compared to gold.
In simple words, this meant that Bitcoin is volatile throughout, by design. However, do not make the assumption that gold is not volatile, it surely is, but in separated phases. Each phase, whether it is high or low, is not representative of its price.
The post appeared first on AMBCrypto


