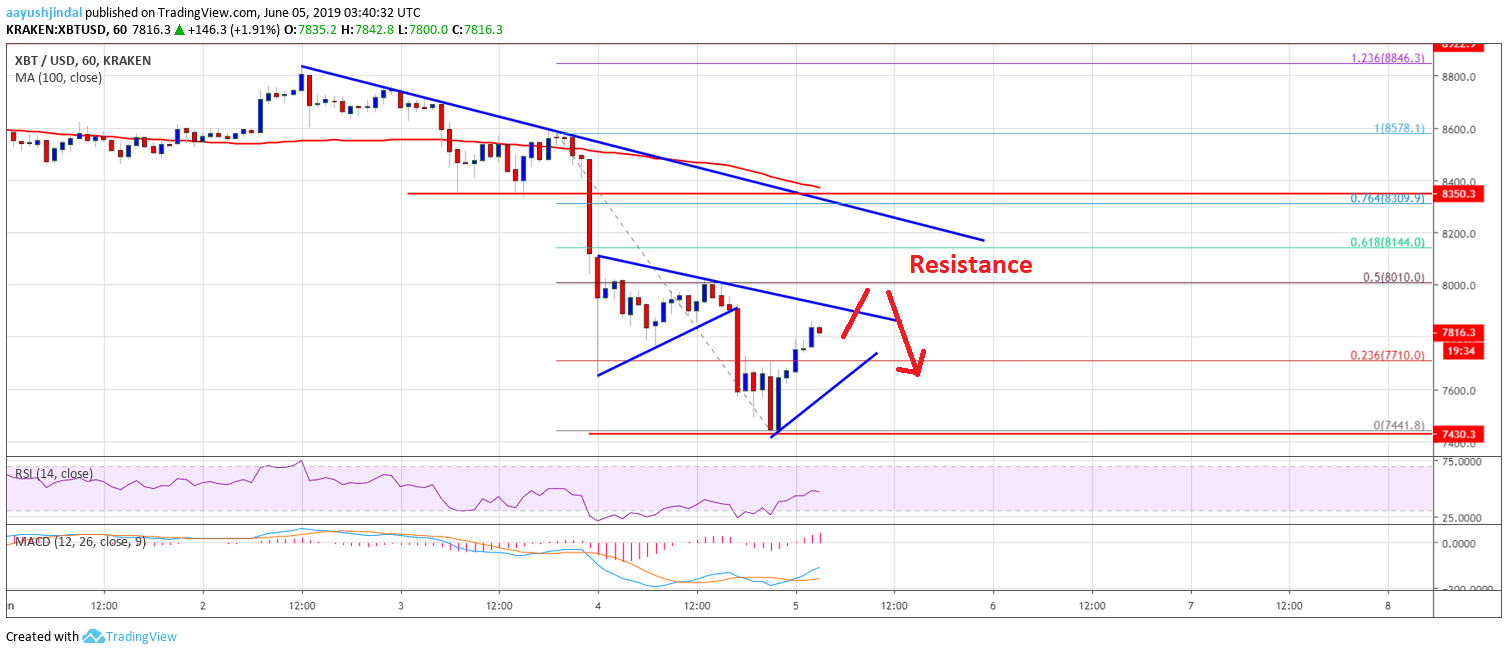
Bitcoin price started a major downward move below the $8,200 and $8,000 supports against the US Dollar.The price even broke the key $7,600 support level and it is currently recovering higher.There are two major bearish trend lines forming with resistance near $7,950 and $8,200 on the hourly chart of the BTC/USD pair (data feed from Kraken).The pair is likely to struggle near the $8,000 and $8,200 resistance levels in the near term.Bitcoin price is facing an increase in selling pressure against the US Dollar. BTC might correct higher, but it is likely to fail near the $8,000 or $8,200 resistance levels.Bitcoin Price AnalysisThere was a steady decline in bitcoin price below the $8,500 and $8,400 support levels against the US Dollar. The BTC/USD pair even broke the key $8,000 support level to enter a bearish zone. Moreover, there was a close below the $8,000 level and the 100 hourly simple moving average. Finally, there was a drop below the $7,600 support level and the price traded to a new weekly low at $7,441.Recently, bitcoin price started an upside correction above the $7,600 level. Besides, there was a break above the 23.6% Fib retracement level of the recent decline from the $8,578 high to $7,441 low. On the upside, there are many resistances near the $7,900, $8,000 and $8,200 levels. There are also two major bearish trend lines forming with resistance near $7,950 and $8,200 on the hourly chart of the BTC/USD pair. An intermediate resistance is near $8,000. It coincides with the 50% Fib retracement level of the recent decline from the $8,578 high to $7,441 low.Therefore, a successful break above the $8,000 level might push the price towards the $8,200 resistance. If there are more upsides, the price could recover towards the $8,400 level or the 100 hourly SMA. Conversely, if bitcoin price fails to move above $8,000, it could decline once again. An initial support is near the $7,600 level. If the bulls fail to hold $7,600, there could be a sharp decline towards the $7,400 support area. Looking at the chart, bitcoin price seems to be following a bearish path from well above $8,400. In the short term, there could be an upside correction, but the price is likely to struggle near $8,000 or $8,200. Only a successful close above $8,200 could kick start a fresh increase in the near term.Technical indicators:Hourly MACD – The MACD is currently gaining pace in the bullish zone.Hourly RSI (Relative Strength Index) – The RSI for BTC/USD is currently moving higher towards the 50 level.Major Support Levels – $7,600 followed by $7,400.Major Resistance Levels – $8,000, $8,200 and $8,400.The post appeared first on NewsBTC


