The price charts at press time displayed that the bearish sentiment was once again regaining control. A typically higher volatility level was witnessed compared to earlier trading sessions.
Most of the major alts were rallying against the buying sentiment. Bitcoin Cash was seen consolidating, after a short pump and dump event. DASH and Dogecoin too struggled to make any gains, as they continued to be bearish.
Bitcoin Cash [BCH]
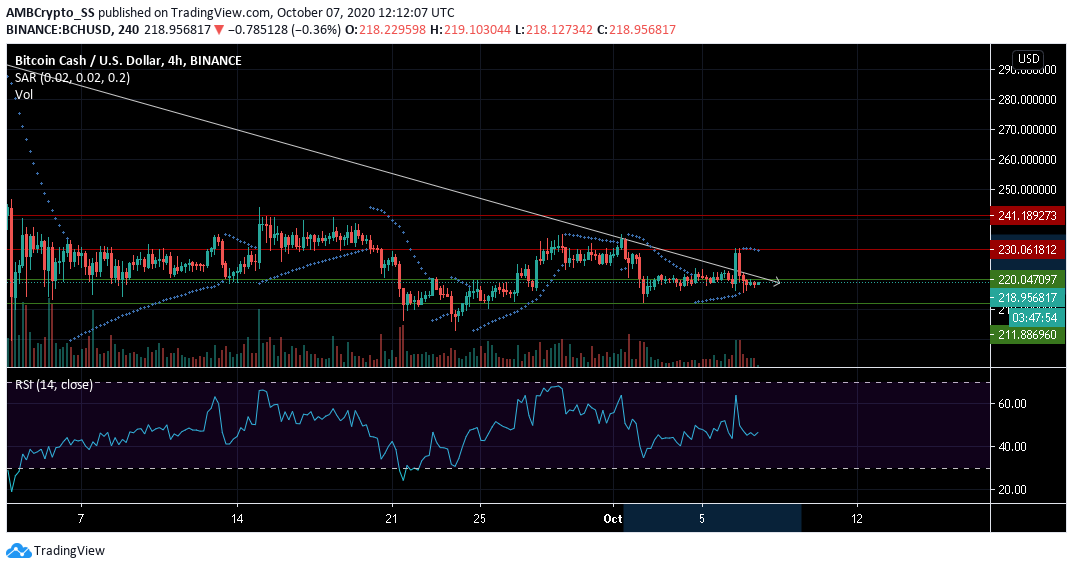
Bitcoin Cash has naturally faced a direct hit from Bitcoin’s previous week sell-off. The digital asset has fallen by more than 8% since the start of October. At the time of writing, BCH was trading at the $218.95, a percent below the crucial support turned resistance at $220.04
After a short pump and dump event with a spike visible in the levels of volumes, BCH continued to display a flat price movement.
Parabolic SAR’s dotted lines above the price candles suggested a downtrend. Relative Strength Index too favored the bears and was seen just below the neutral zone.
Any further rise in selling pressure could break the ongoing consolidation, and push down prices to the $ 211.88 level.
DASH
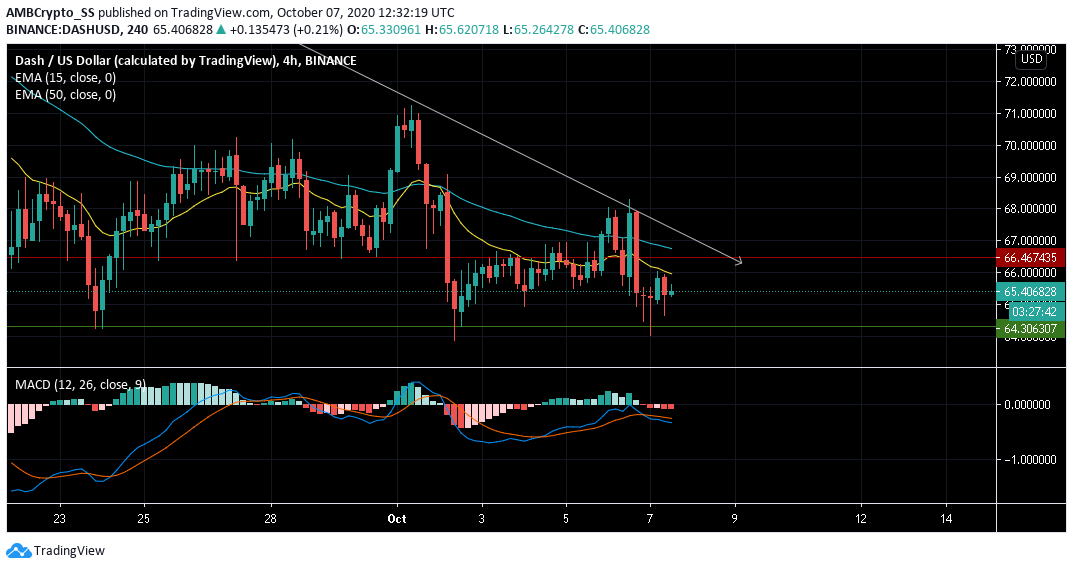
For DASH, the 15-day exponential moving average (EMA) was seen ticking to the downside, way below the 50 EMA. This indicated that momentum in the short term was driving price towards the $64.3 level of support.
The MACD also gave a sell signal as it was seen making a bearish crossover.
A break below the $ 65.5 pivot level could cause continuation to the downside with DASH bulls failing to halt the losses in the upcoming trading sessions.
Informing its investors, the digital asset’s official twitter handle recently announced the release of Dash Master node Tool v0.9.26-hotfix3 . The upgrade would also help users connect to v0.16 nodes.
Dogecoin [DOGE]
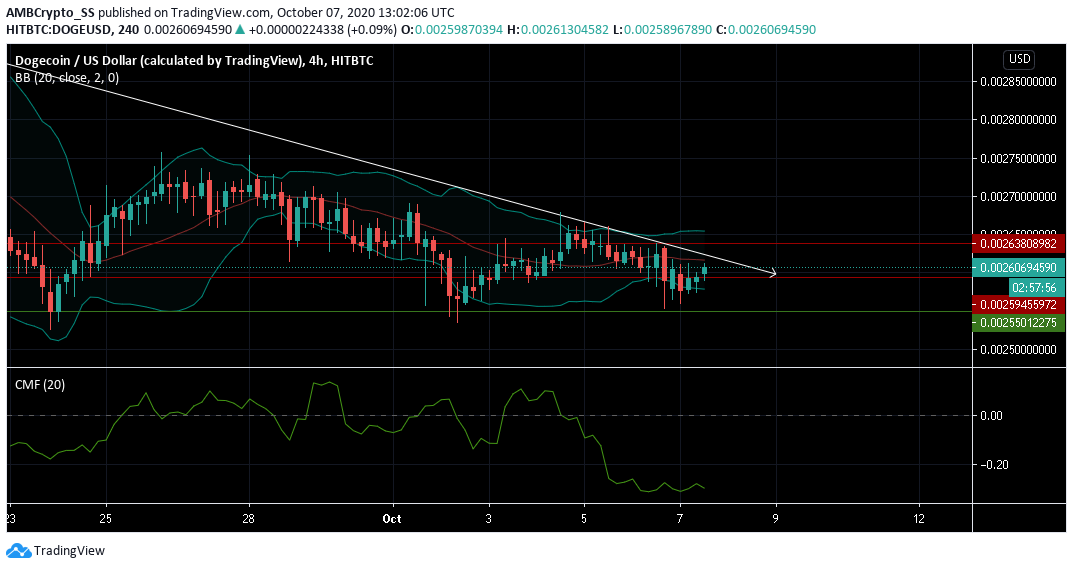
Dogecoin after reeling under sufficient selling pressure finally managed to breach the $0.0025 level of resistance. This could be a reversal after a slight descending channel pattern; however, the bearish scenario was far from over.
The Chaikin Money Flow Indicator was well below the zero line, signaling the amount of capital outflows was much higher than the capital inflows. This hinted towards a scenario of massive sell-offs taking place.
At the time of writing volatility also seemed to be on the rise, with a hint of widening visible from the Bollinger bands.
The post appeared first on AMBCrypto


