Bitcoin Cash, while it shared some of the positive sentiment around Bitcoin, could be set to retest a support level, before moving north on the charts once more. Further down the crypto-ladder, IOTA formed a bullish pattern, but failed to break out upwards and it could be set to register losses over the next days. Finally, DigiByte was steadily losing value on its own charts.
Bitcoin Cash [BCH]


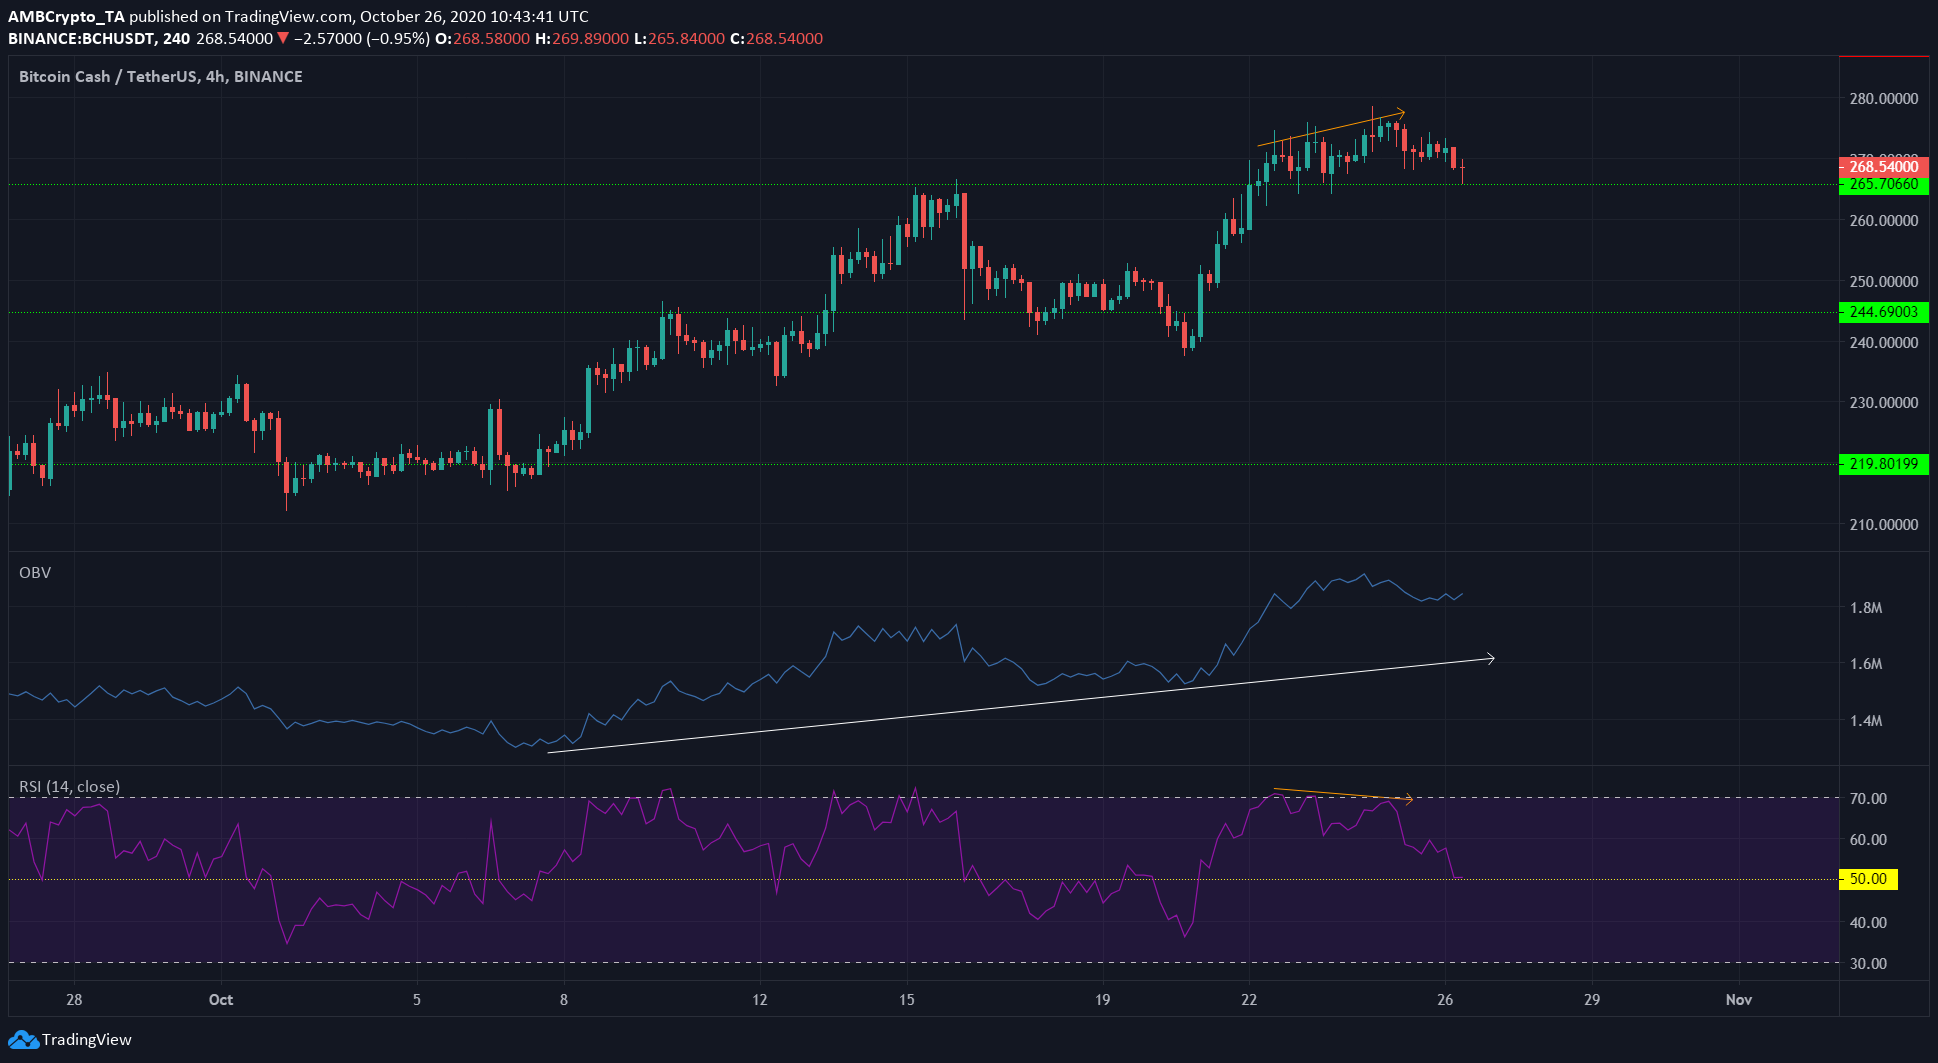
Source: BCH/USDT on TradingView
Bitcoin Cash exhibited a bearish divergence between the price and its momentum. BCH registered higher highs while the momentum indicator noted lower highs (orange), and this was followed by a nearly 4% drop on the charts.
The price of the cryptocurrency had tested $266 as support. It was likely that the price and the RSI would bounce upwards, and BCH would resume its uptrend over the next few days.
The OBV also underlined healthy buying volumes as it continued to set a series of higher lows.
IOTA


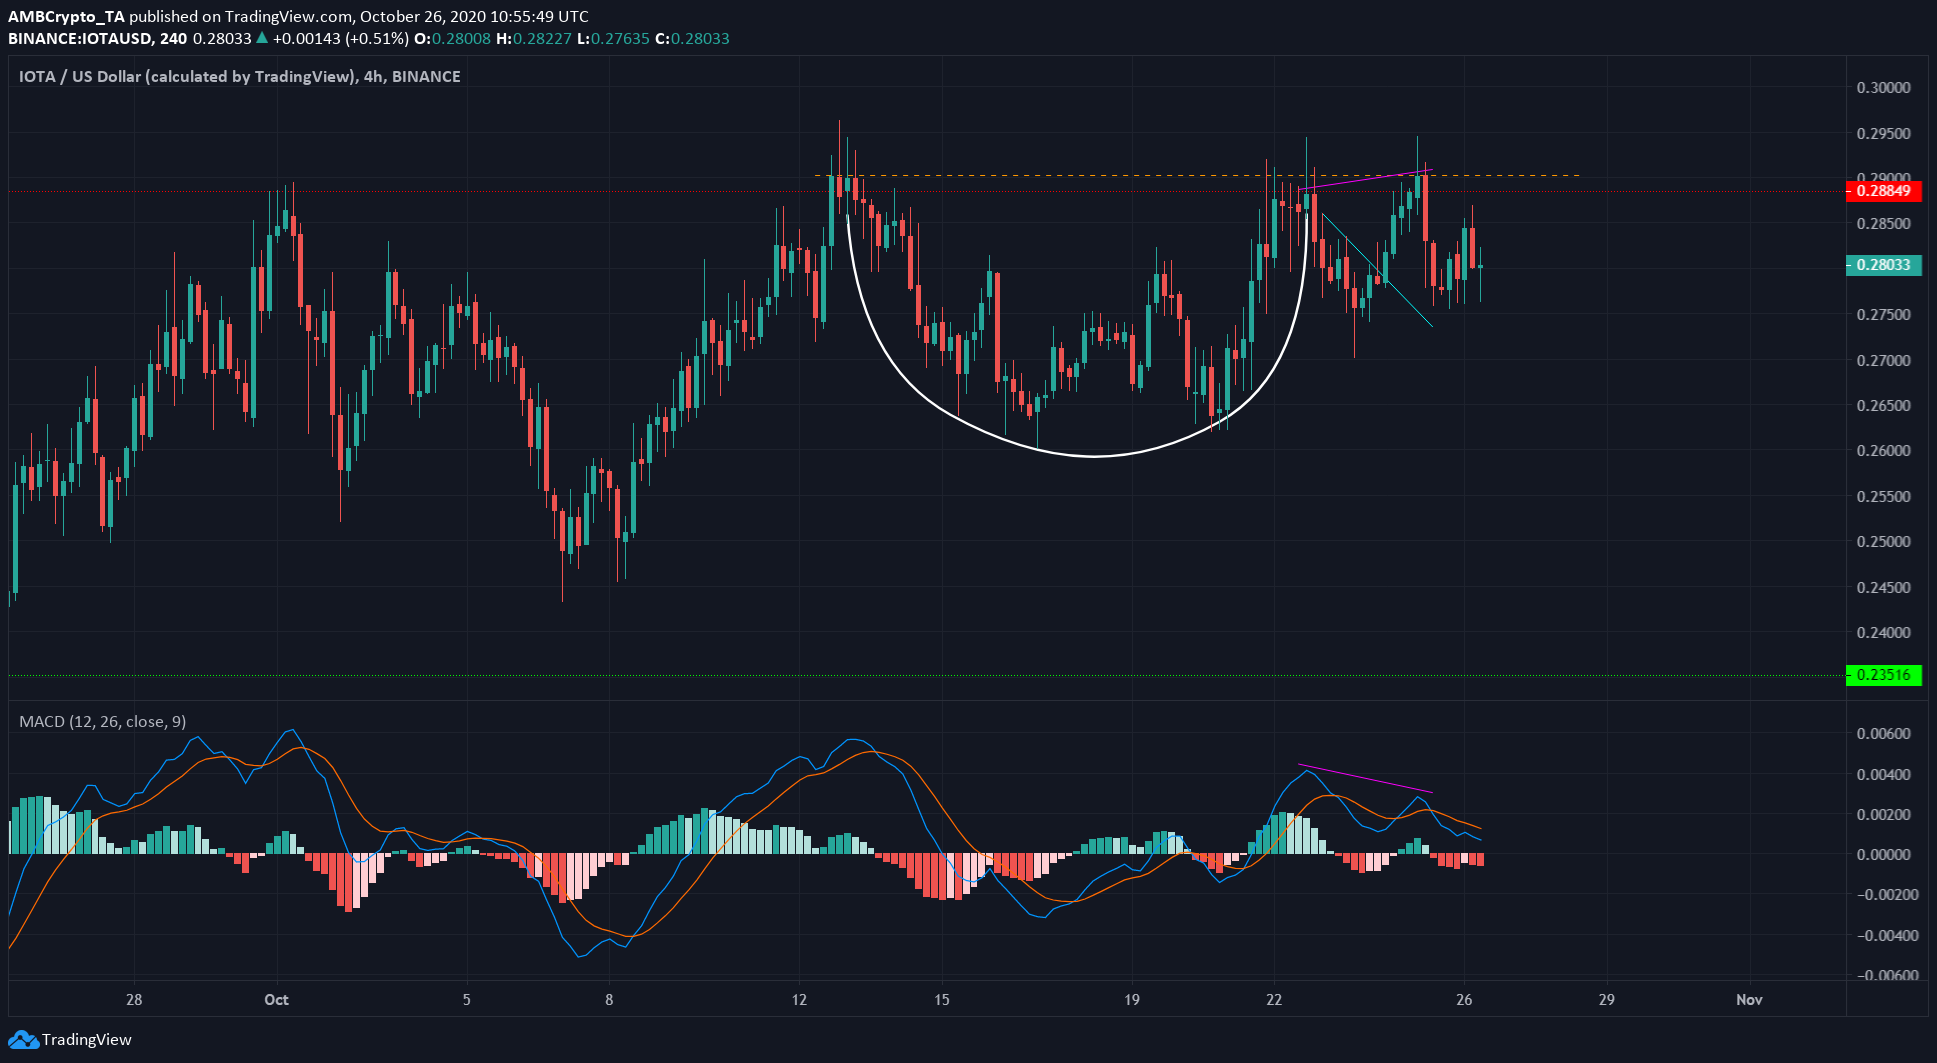
Source: IOTA/USD on TradingView
IOTA appeared to form a cup and handle pattern (white), with the rim indicated in orange (dotted). And yet, the price was unable to break out past the rim.
A bearish divergence was noted at that point between the price and the momentum (pink). Subsequently, IOTA was pushed south on the charts.
At press time, the MACD had formed a bearish crossover above zero. While a weak sell signal, it was possible for IOTA to drop towards the support at $0.264 over the next few days.
In other news, a recent AMA with IOTA’s Founders saw them address the development, goals, and challenges IOTA faced.
DigiByte [DGB]


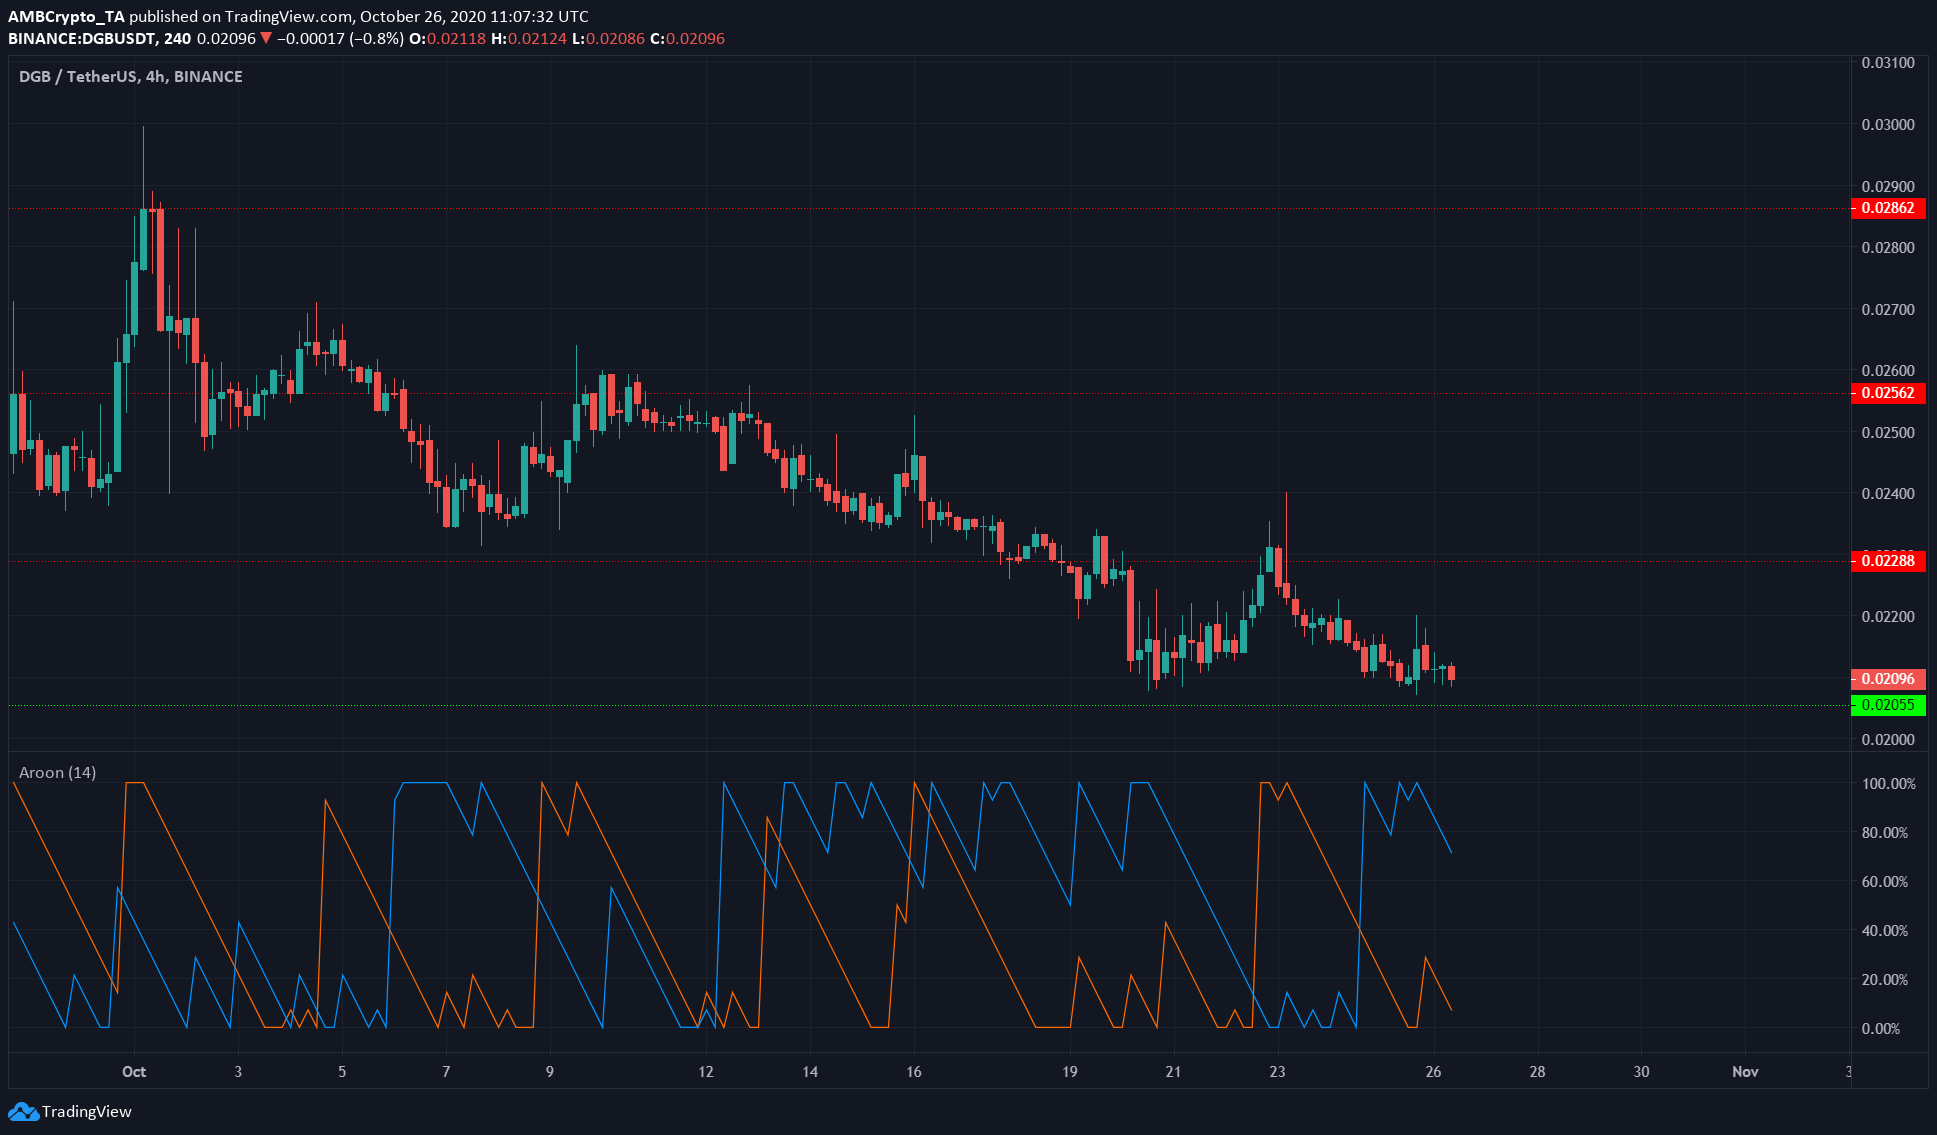
Source: DGB/USDT on TradingView
DGB was heading towards a level of support it bounced strongly off back in mid-September. The Aroon Indicator showed that the trend was strongly bearish for the crypto-asset, with brief relief rallies noted by the crypto-asset.
The $0.02 level was pivotal for the DGB bulls to defend. Its recent surge to the resistance level at $0.228 and the strong rejection at that level could embolden the market’s bears to drive the price further lower on the charts.
The post appeared first on AMBCrypto


