Disclaimer: The following article should not be taken as investment advice. The findings of the same should be foreseeable over the next couple of weeks
The bullish trend so evident in the early days of August is slowly starting to fade, with a majority of the market’s altcoins taking a dive on their charts. However, that hasn’t been the case for a cryptocurrency like Bitcoin Cash. For BCH, the trend has been consistently neutral, especially since it breached its resistance at $273 on 28 July.
A period of consolidation was observed soon after, but after 3 weeks of uncertainty, a definitive bearish sign might finally be emerging on the charts for Bitcoin Cash.
Bitcoin Cash 1-day chart


Source: BCH/USD on TradingView
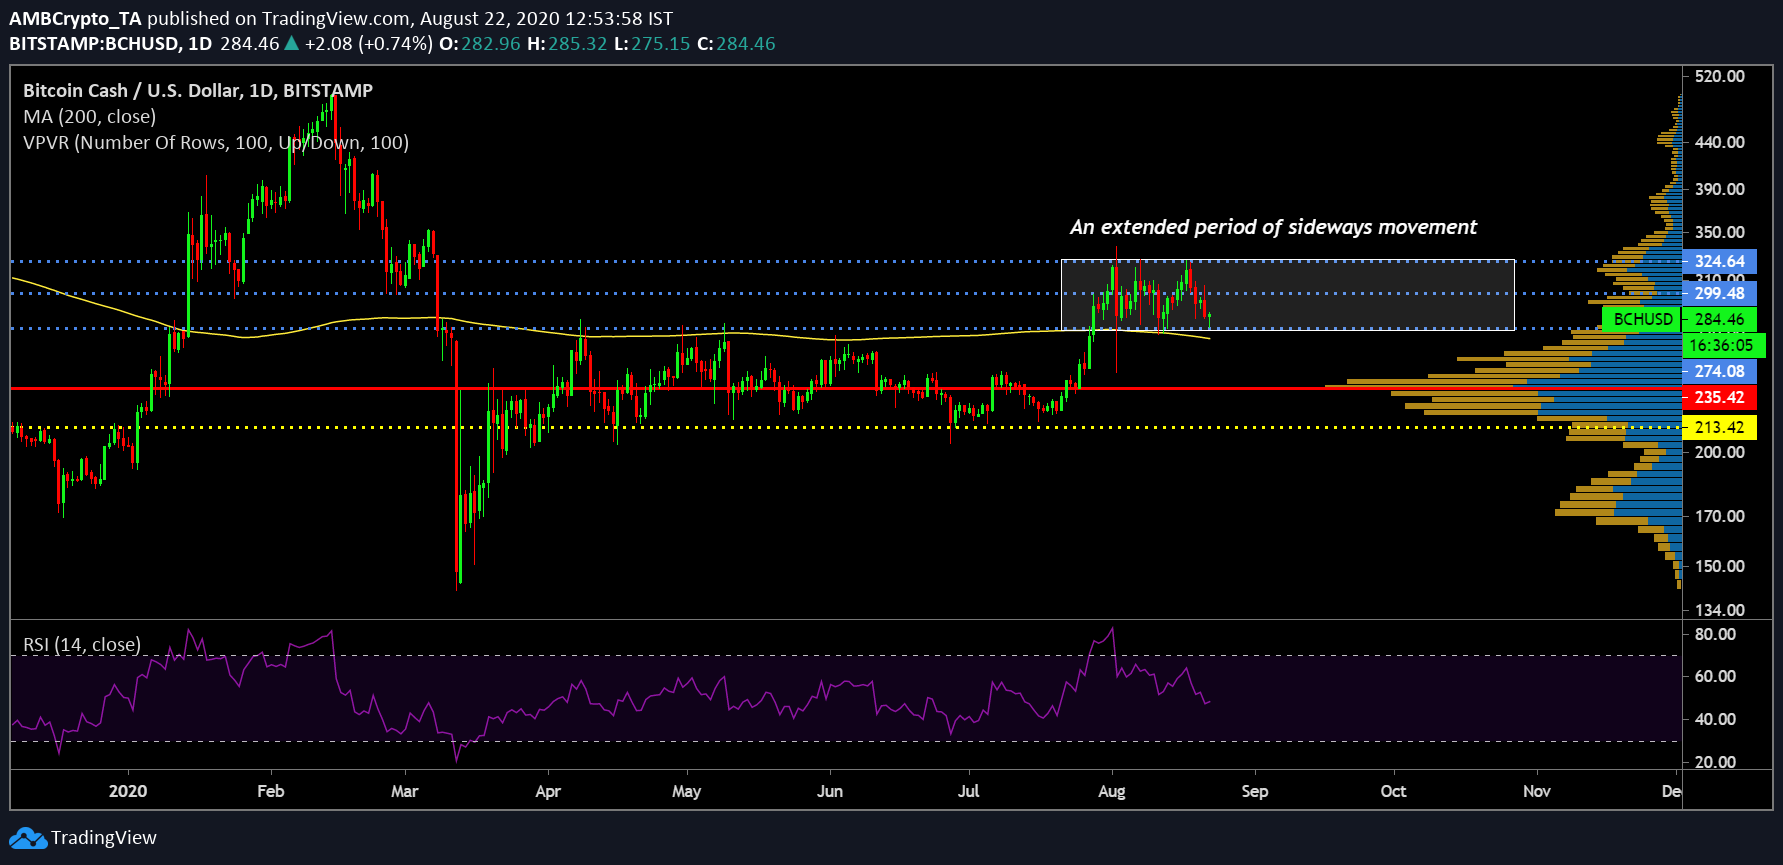
As mentioned above, Bitcoin Cash hasn’t been registering a proper trend after crossing $273 on its charts. It tested its resistance at $325 on 2 August and since then, an extended period of sideways movement has been the norm for the crypto. In the last three weeks, BCH has also tested the $324-level three times, the last being on 17 August. And while the situation at press time had some bearish undercurrents, it did have some positives as well.
For starters, the Relative Strength Index continued to bestow its presence as strong underlying support from which the price was bouncing back multiple times on the chart. The resistance at $274 has also been strong in that regard, but the VPVR indicator suggested that the trading volume at BCH’s press time price meant uncertainty. If this bearish pressure is able to sustain itself, it is very likely that the crypto-asset will drop below $274 over the next couple of weeks and hold a position at around $250.
While the Relative Strength Index or RSI has been on a decline, at the time of writing, it was placed at a point where the buying and selling pressures were in a neutral place.
Bitcoin Cash 1-Week chart
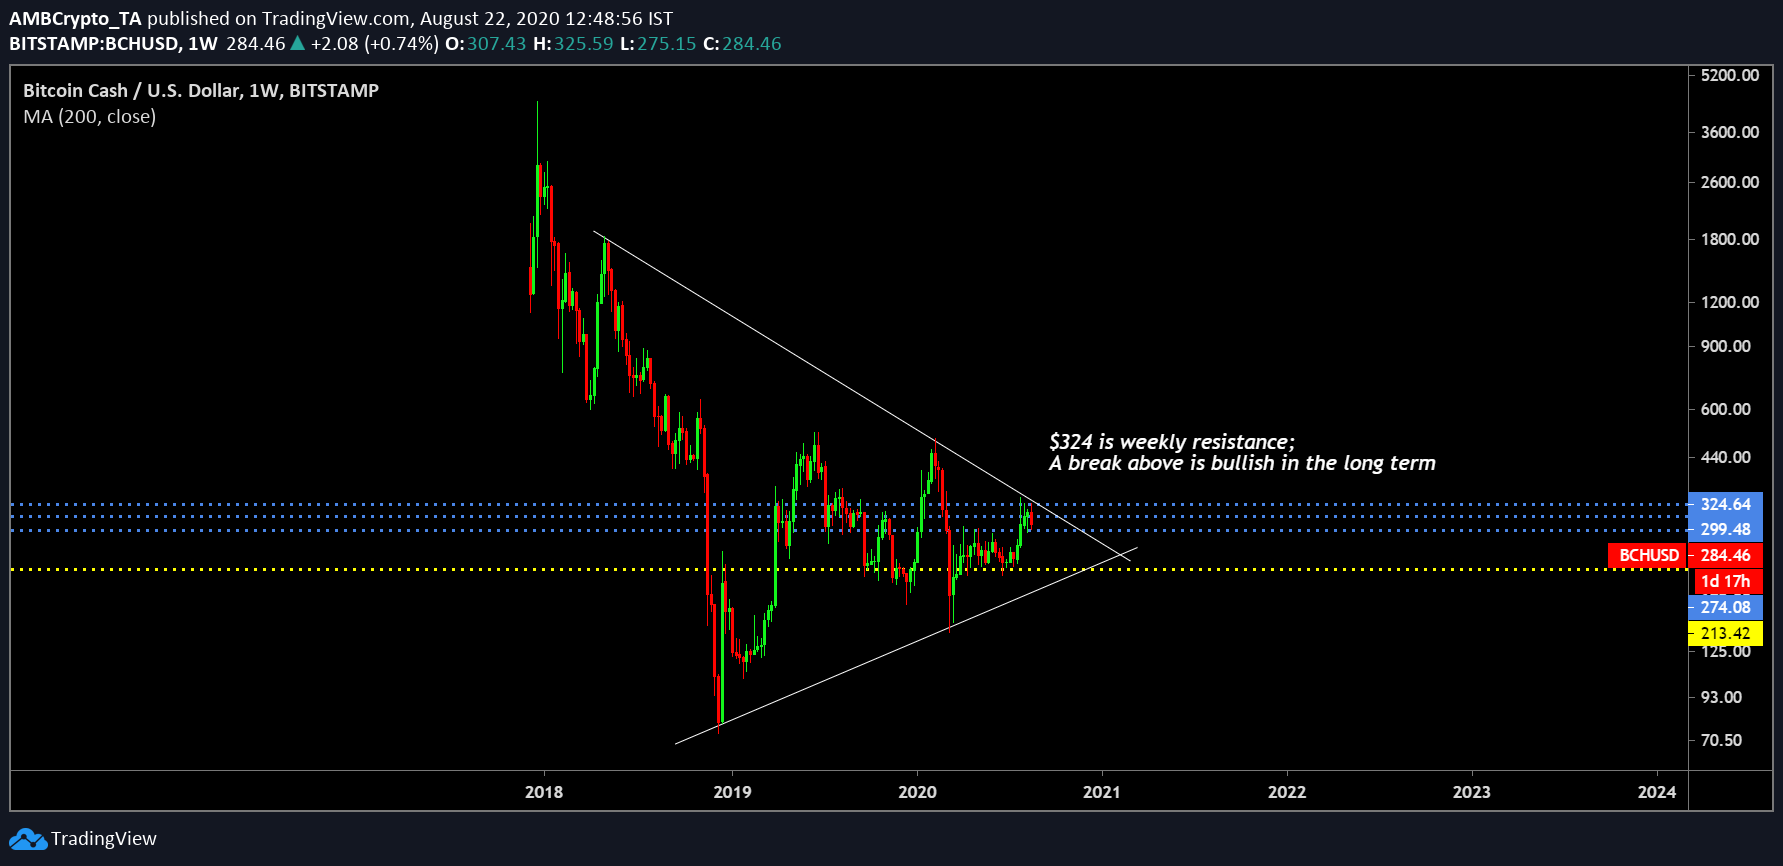
From a long-term perspective, the importance of the $324 resistance is even more evident. The weekly chart suggested that the aforementioned level has been a very strong weekly resistance level for the crypto and considering the fact that the crypto-asset is able to muster a move above the price point, this could possibly trigger a long-term bullish rally.
At the time of writing, this wasn’t as likely, but it is something to keep one’s mind on going into the 4th quarter of 2020.
Conclusion
Bitcoin Cash may drop below $274 in the next couple of weeks due to high selling pressure.
The post appeared first on AMBCrypto


