Following Bitcoin’s footsteps, many of the market’s altcoins noted a slump in their price when the week began. The case for Bitcoin Cash was the same, with the coin falling on the charts by over 10 percent on 21 September. Since then, BCH has registered lower lows and lower highs and the coming week is likely to settle the direction in which Bitcoin Cash’s price will move.
At press time, Bitcoin Cash was being traded at $212 with a market cap of $3.9 billion. Over the course of the past 24-hours, BCH was observed to have registered a minor drop of 0.7 percent, after having noted a trading volume of $1.3 billion.
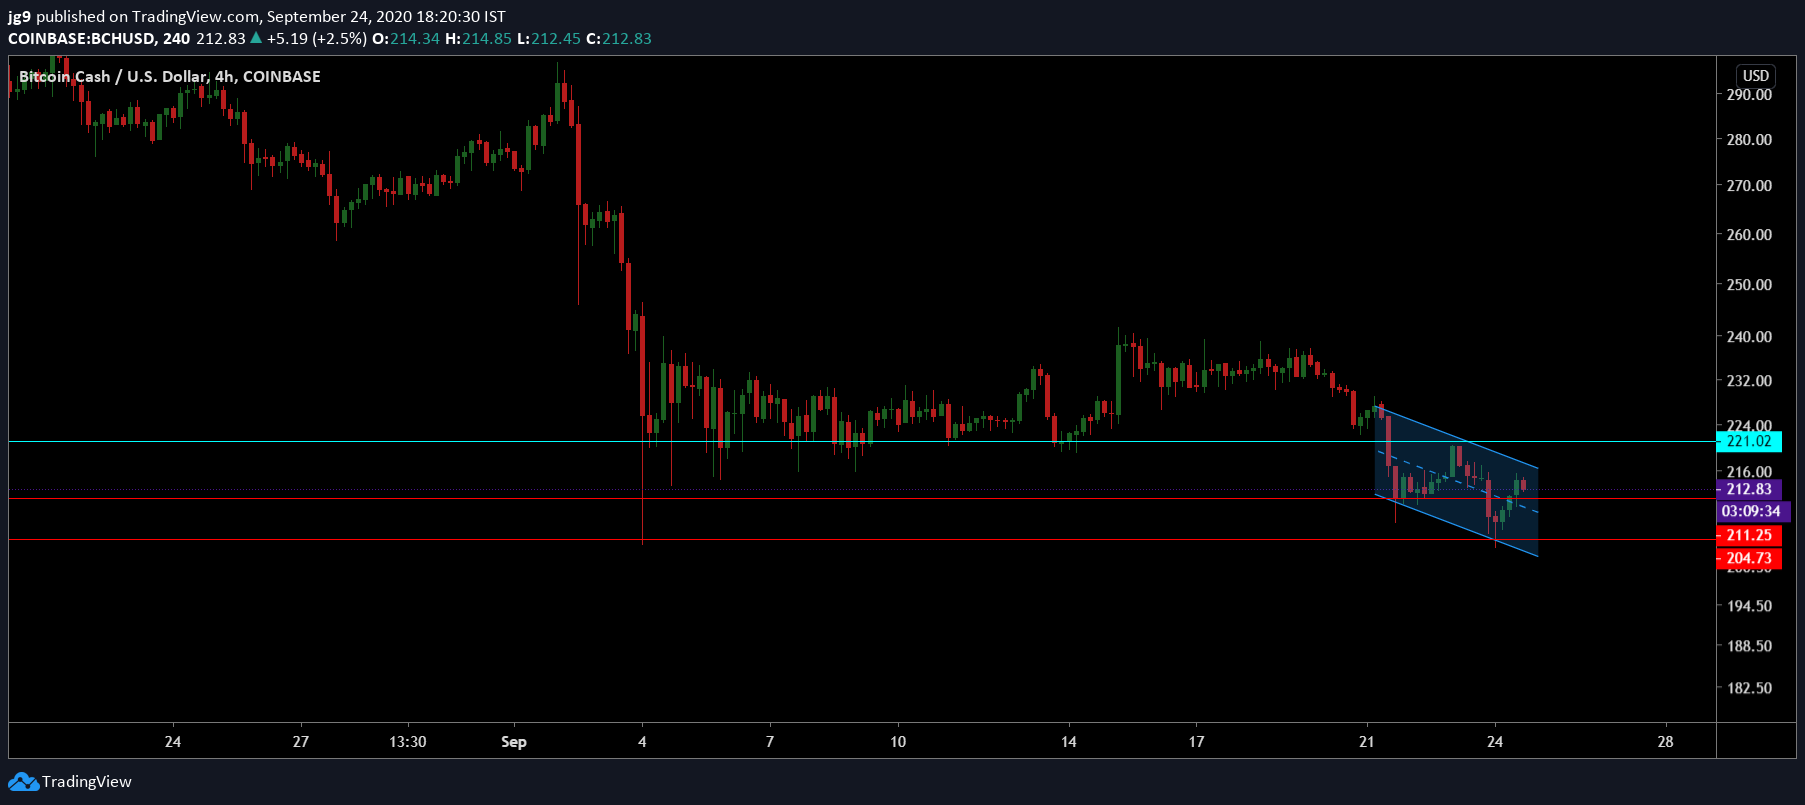
Bitcoin Cash 4-hour chart


Source: BCH/USD, TradingView
According to the 4-hour chart for Bitcoin Cash, the coin’s price action has been part of a descending channel formation and in the coming week, the price may continue to remain within the formation. However, it might also register a breakout, one which is traditionally likely to be northbound.
At press time, BCH was very close to testing the support at $211, and if the coin were to endure even more bearish pressure, the cryptocurrency may need the help of its second support level at $204. However, if the breakout does happen in the coming week, then BCH may head towards the resistance level at $221.


Source: BCH/USD, TradingView
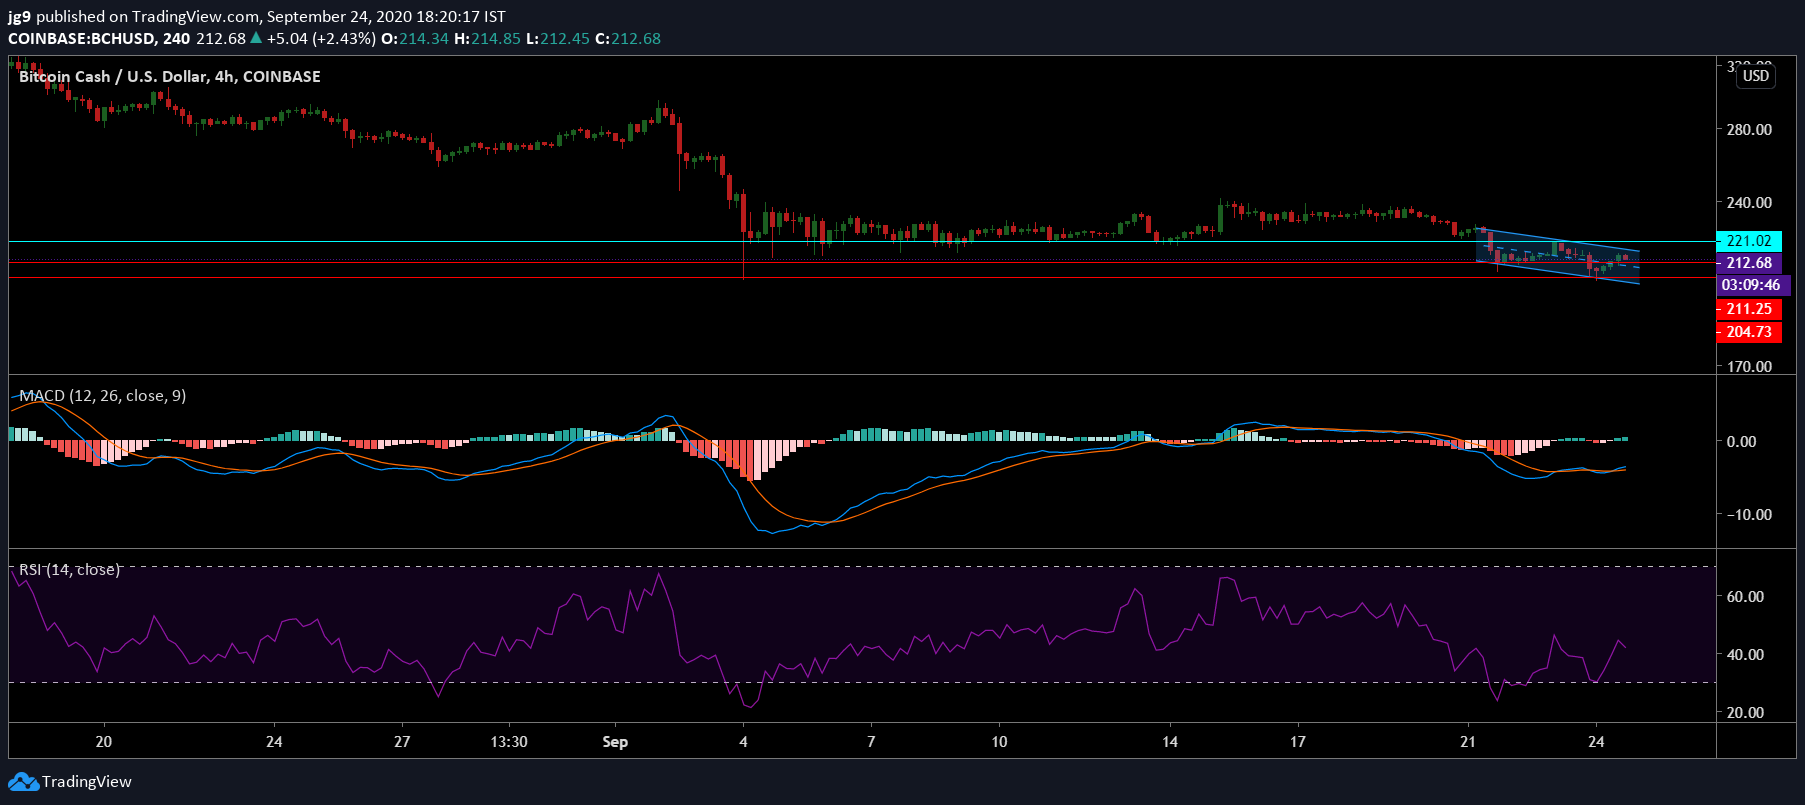
As per the cryptocurrency’s technical indicators, it is likely that BCH may try to move out of the descending channel formation in the coming week. The MACD indicator had just undergone a bullish crossover, with the MACD line inching past the Signal line. The RSI, on the other hand, seemed to be moving away from the neutral zone and back into the oversold zone.


Source: CoinMetrics
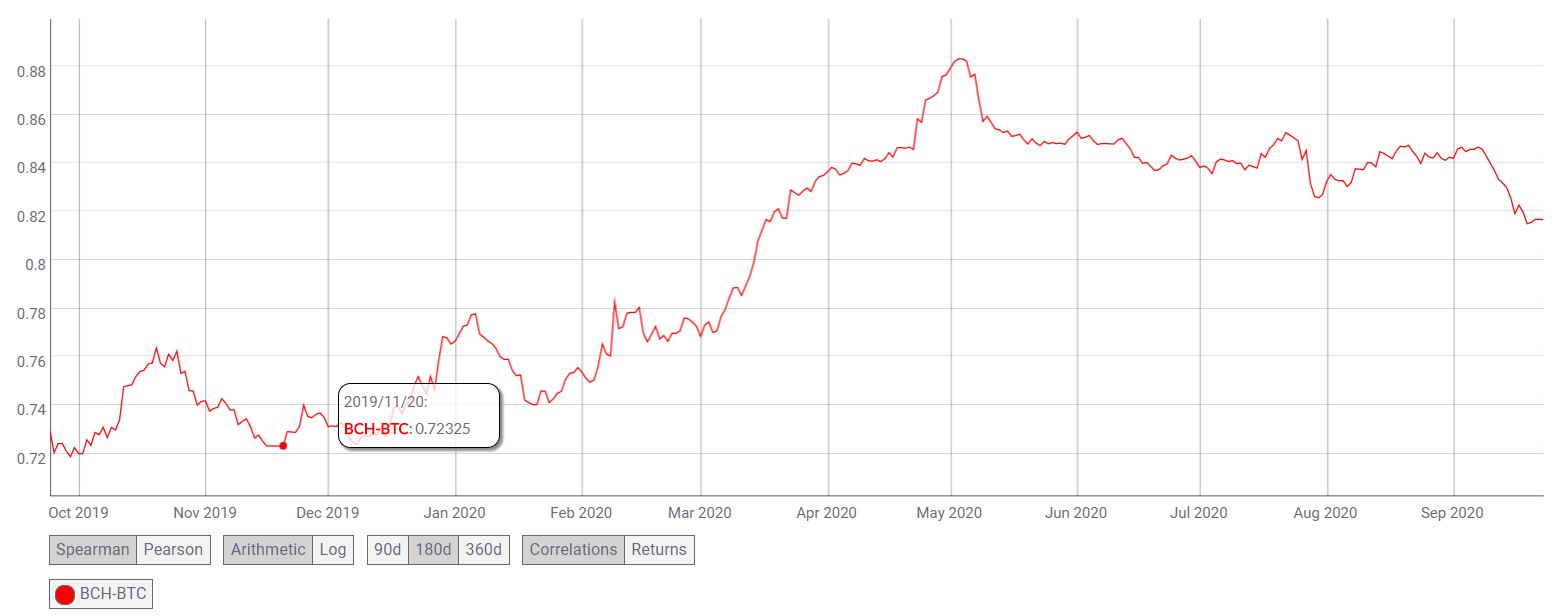
In sync with the market’s altcoins, the correlation with Bitcoin remained strong for BCH and can be considered to be the reason behind the previous week’s fall. Over the past year, the BCH-BTC correlation has risen from 0.72 to 0.81, making BCH extremely likely to dance to Bitcoin’s tune.
Conclusion
Bitcoin Cash has been confined within the descending channel formation and over the coming week, provided there is significant bullish pressure, it will make an attempt to break out of the price formation. In such a case, its immediate resistance at $221 will be its likely target. However, if the cryptocurrency’s price continues to exist within the formation, then a dip towards the second support level at $204 cannot be ruled out.
The post appeared first on AMBCrypto


