Proving to be one of the market’s top-performing digital assets on the charts, Bitcoin Cash was quick to add over 6% to its value in lieu of the prevailing bull market. Decred too was painted in green, with northbound price momentum in the DCR market likely to push the cryptocurrency towards its immediate resistance level.
On the contrary, NEM seemed to be gearing up for a steep fall as the bears had taken over the market.
Bitcoin Cash [BCH]


Source: BCH/USD on TradingView
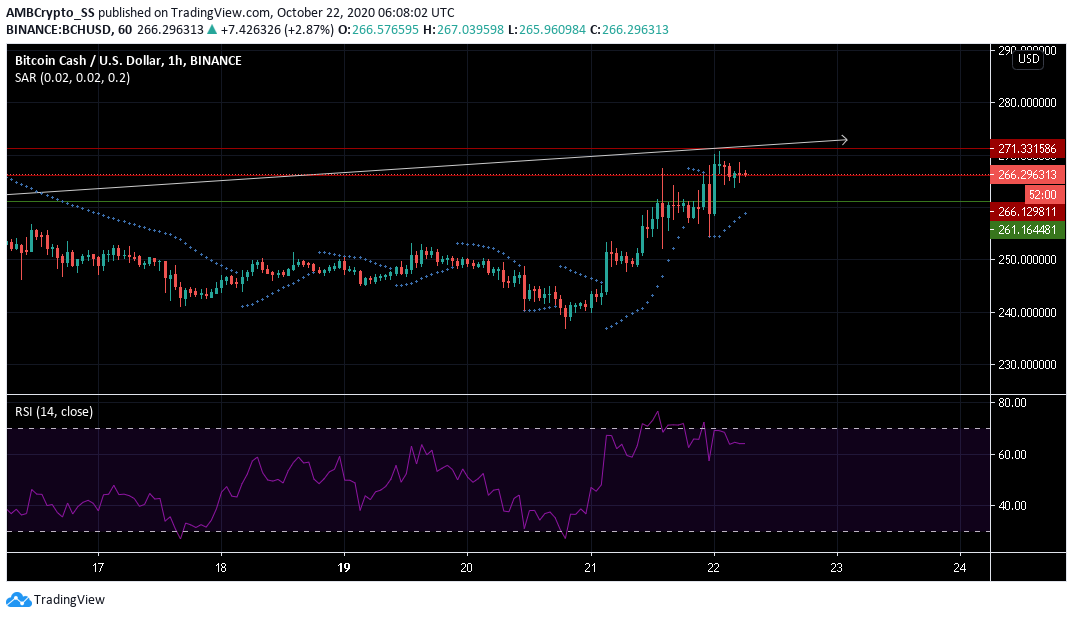
Fueled by strong buying momentum, the Bitcoin Cash market registered a positive uptrend, returning gains worth 6.7% over the last 24 hours.
With the formation of the dotted markers below the candlesticks, the Parabolic SAR indicator eliminated the likelihood of the altcoin noting a bearish breakout.
The Relative Strength Index was seen hovering just below the overbought territory, highlighting the continuing presence of strong buying sentiment.
Given this scenario in the BCH market, a pullback could be expected from the $ 266.29-level, towards the next level of resistance.
NEM [XEM]


Source: NEM/USD on TradingView
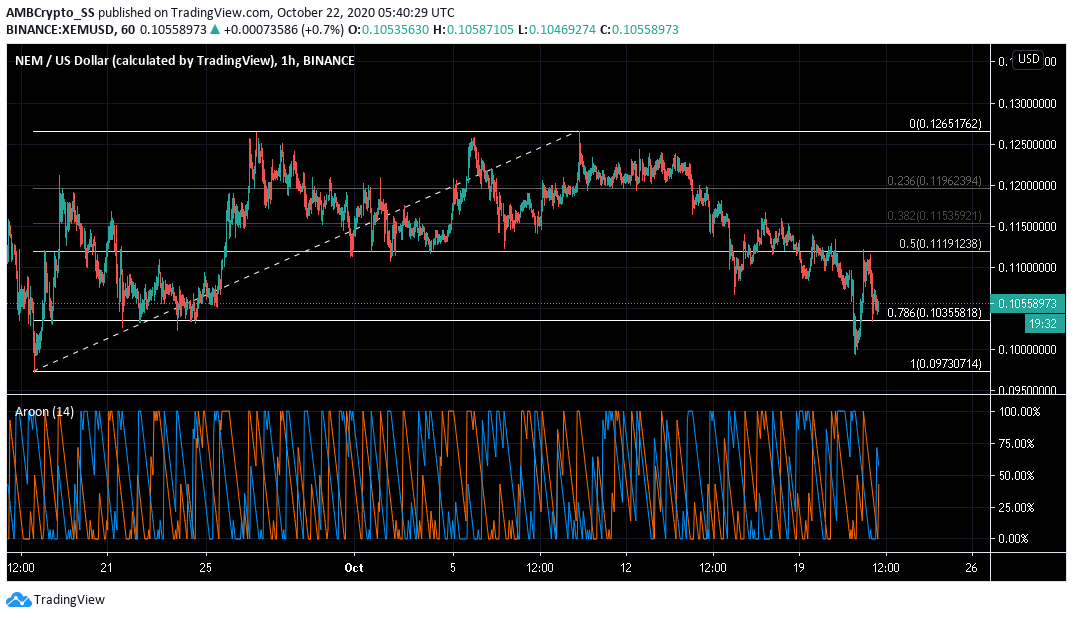
NEM, at the time of writing, was displaying signs of being close to a drawdown in price as the 78.6% retracement region marked by the Fibonacci Retracement tool continued to weaken in lieu of bearish pressure.
In fact, the digital asset’s fortunes were likely to be bearish if the sellers manage to further push prices below the $ 0.103-level of support. as was seen over the last few days.
The Aroon indicator signaled a bearish crossover, with the Aroon Up (Orange) falling below the Aroon Down (Blue).
In light of rising selling pressure and the digital asset recording 5% losses since yesterday, NEM’s prices could go below the 78.6% level over the next few days.
Decred [DCR]


Source: DCR/USD on TradingView
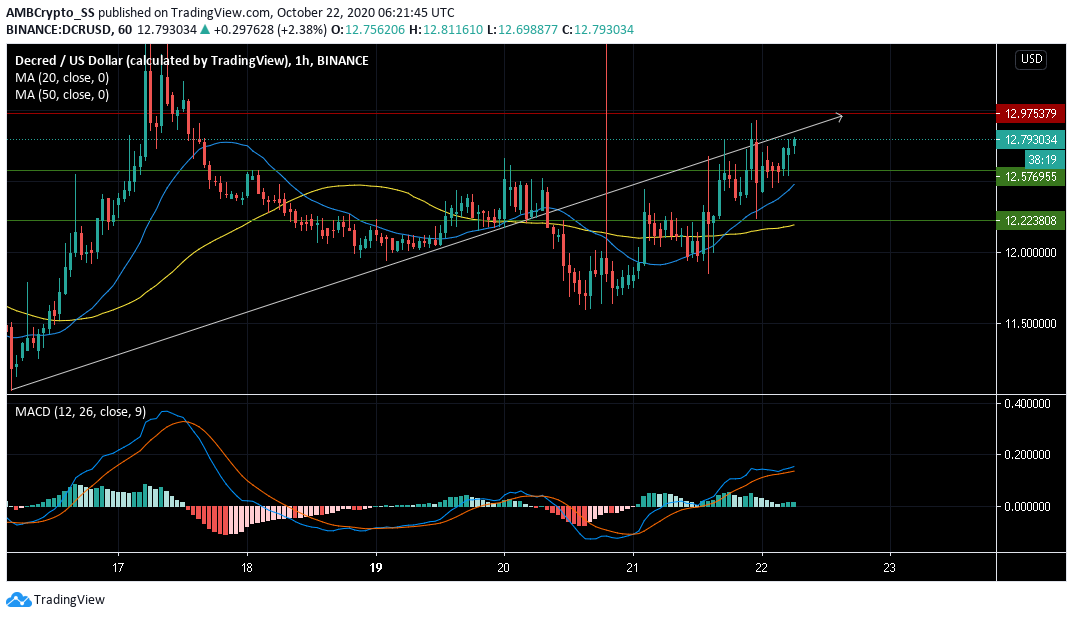
At the time of writing, Decred was seen trading around the $12.793-level. In fact, the altcoin jumped to recover with 4.3% in recorded gains over the last 24 hours.
Decred’s technical indicators also continued to be bullish. Over the aforementioned period, the MACD noted a bullish crossover, with the MACD line rising above the Signal line.
Further, the simple moving averages (SMA) too broke out in a bullish trend at the same time. The 20 SMA was seen rising above the 50 SMA. A closer look at the simple moving averages seemed to rule out the likelihood of sell-offs too.
In order to validate the immediate bullishness seen at press time, DCR bulls will have to control the $12.97-level of resistance over the next few trading sessions.
The post appeared first on AMBCrypto


