- Bitcoin Cash would remain bearish as long as the price action remains inside the daily channel against the US Dollar
- The price is still up 1.87% despite the recent bearishness in the overall market
- Against Bitcoin, BCH is currently relying on 0.033 BTC support level
BCH/USD: BCH Rejecting At $240 Resistance
Key Support Levels: $240, $280, $351
Key Resistance Levels: $200, $169, $141
After a massive crash earlier this month, Bitcoin Cash saw a significant recovery over the past days, but the market is still looking fragile on the intraday trading.
However, BCH has managed to hold gains above the $200 despite the weekend drops.
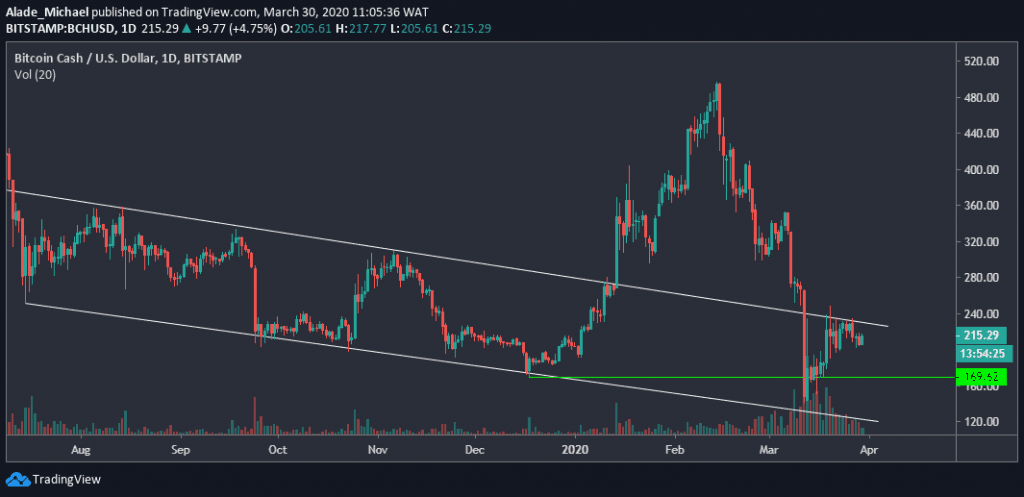
As of the time of writing, BCH is trading around $215 against the US Dollar. The bulls are struggling to break above the 8-month descending channel, but facing a lot of resistance around $240.
As long as Bitcoin Cash remains trapped in this channel, it might be very difficult for the bulls to regain control of the market. However, the green line of $169 (December 2019 low) could serve as a rebound level in case of a drop.
Bitcoin Cash Price Analysis
As mentioned above, Bitcoin Cash is facing tough resistance at $240, around the channel’s upper boundary. If the buyers push strongly above this resistance, the initial resistance to keep an eye on is $280, followed by $351 resistance, from where BCH price sold off earlier this month.
A continuous rejection could send the price to a psychological level of $200. Below this support lies $169, marked green on the daily chart. If BCH dips below this support line, the price could slip back to $140 – which is the monthly low. The trading volume is quite moderate at the moment.
BCH/BTC: BCH Approaching Crucial Support Level
Key Support Levels: 0.0351 BTC, 0.0375 BTC, 0.040 BTC
Key Resistance Levels: 0.033 BTC, 0.030 BTC, 0.028 BTC
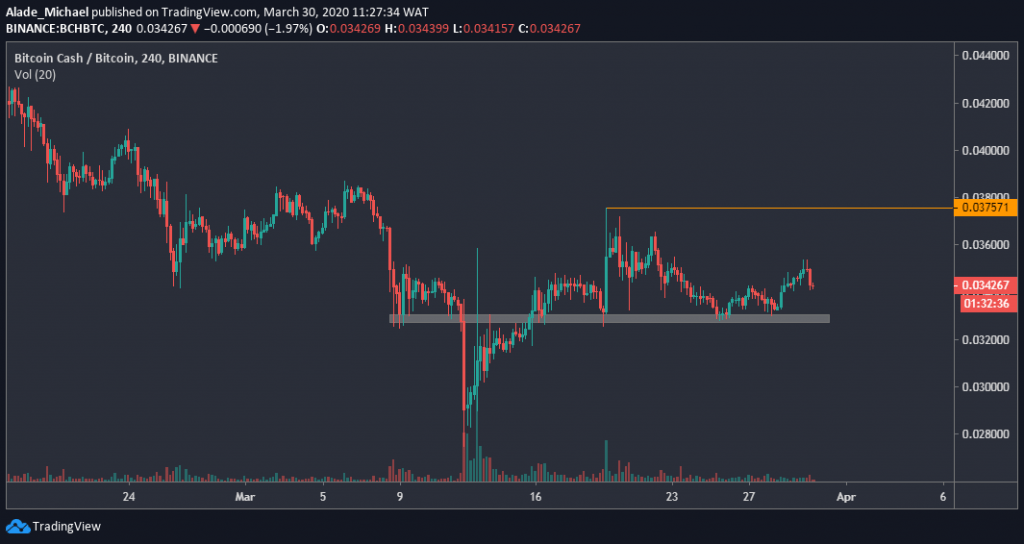
Bitcoin Cash continues to trade sideways after being rejected from 0.0375 BTC level, marked orange on the 4-hours chart. Meanwhile, trading activity is quite low over the past few days.
BCH has continued to stay above crucial support of 0.033 BTC (marked grey on the 4-hours chart) since the price bounced back from 0.028 BTC level on March 12.
Following 1% drops over the past 24-hour, however, Bitcoin Cash is now trading around 0.0342 BTC as bears regroup back in the market. Though, there’s still hope for a rebound.
At the same time, bearish action is likely to resume if Bitcoin Cash drops below this crucial support.
Bitcoin Cash Price Analysis
BCH is trading near the 0.033 BTC support level. A break below this support could cause a serious dip to 0.030 BTC. If this support fails to contain the selling pressure, the price may roll back to 0.028 BTC (the monthly low).
In case BCH recovers back above 0.0351 BTC, which is today’s current high, the next resistance would be 0.03757 BTC, marked orange on the above chart. Above this resistance lies at 0.0395 BTC, from where BCH initiated sell three weeks back. As of now, BCH is looking indecisive in the short-term.
The post Bitcoin Cash Price Analysis: BCH Holds Gains Above $200 Despite Weekend’s Drop, But Will It Break Up? appeared first on CryptoPotato.
The post appeared first on CryptoPotato


