Disclaimer: The following analysis attempt to foresee Bitcoin Cash’s [BCH] price movement in the short-term.
The cryptocurrency market has been in a Kangaroo phase, where the asset prices swing up and dive down instantly. Bitcoin Cash [BCH], the fork of Bitcoin has been on a downtrend and recently experienced a 5% drop in an hour’s time, pushing its price lower from $235 to $223.
At press time the value of Bitcoin Cash was close to $228, while the market cap rested at $4.22 billion. The fifth-largest digital asset has reported a 24-hour trading volume of $1.03 billion, according to CoinMarketCap.


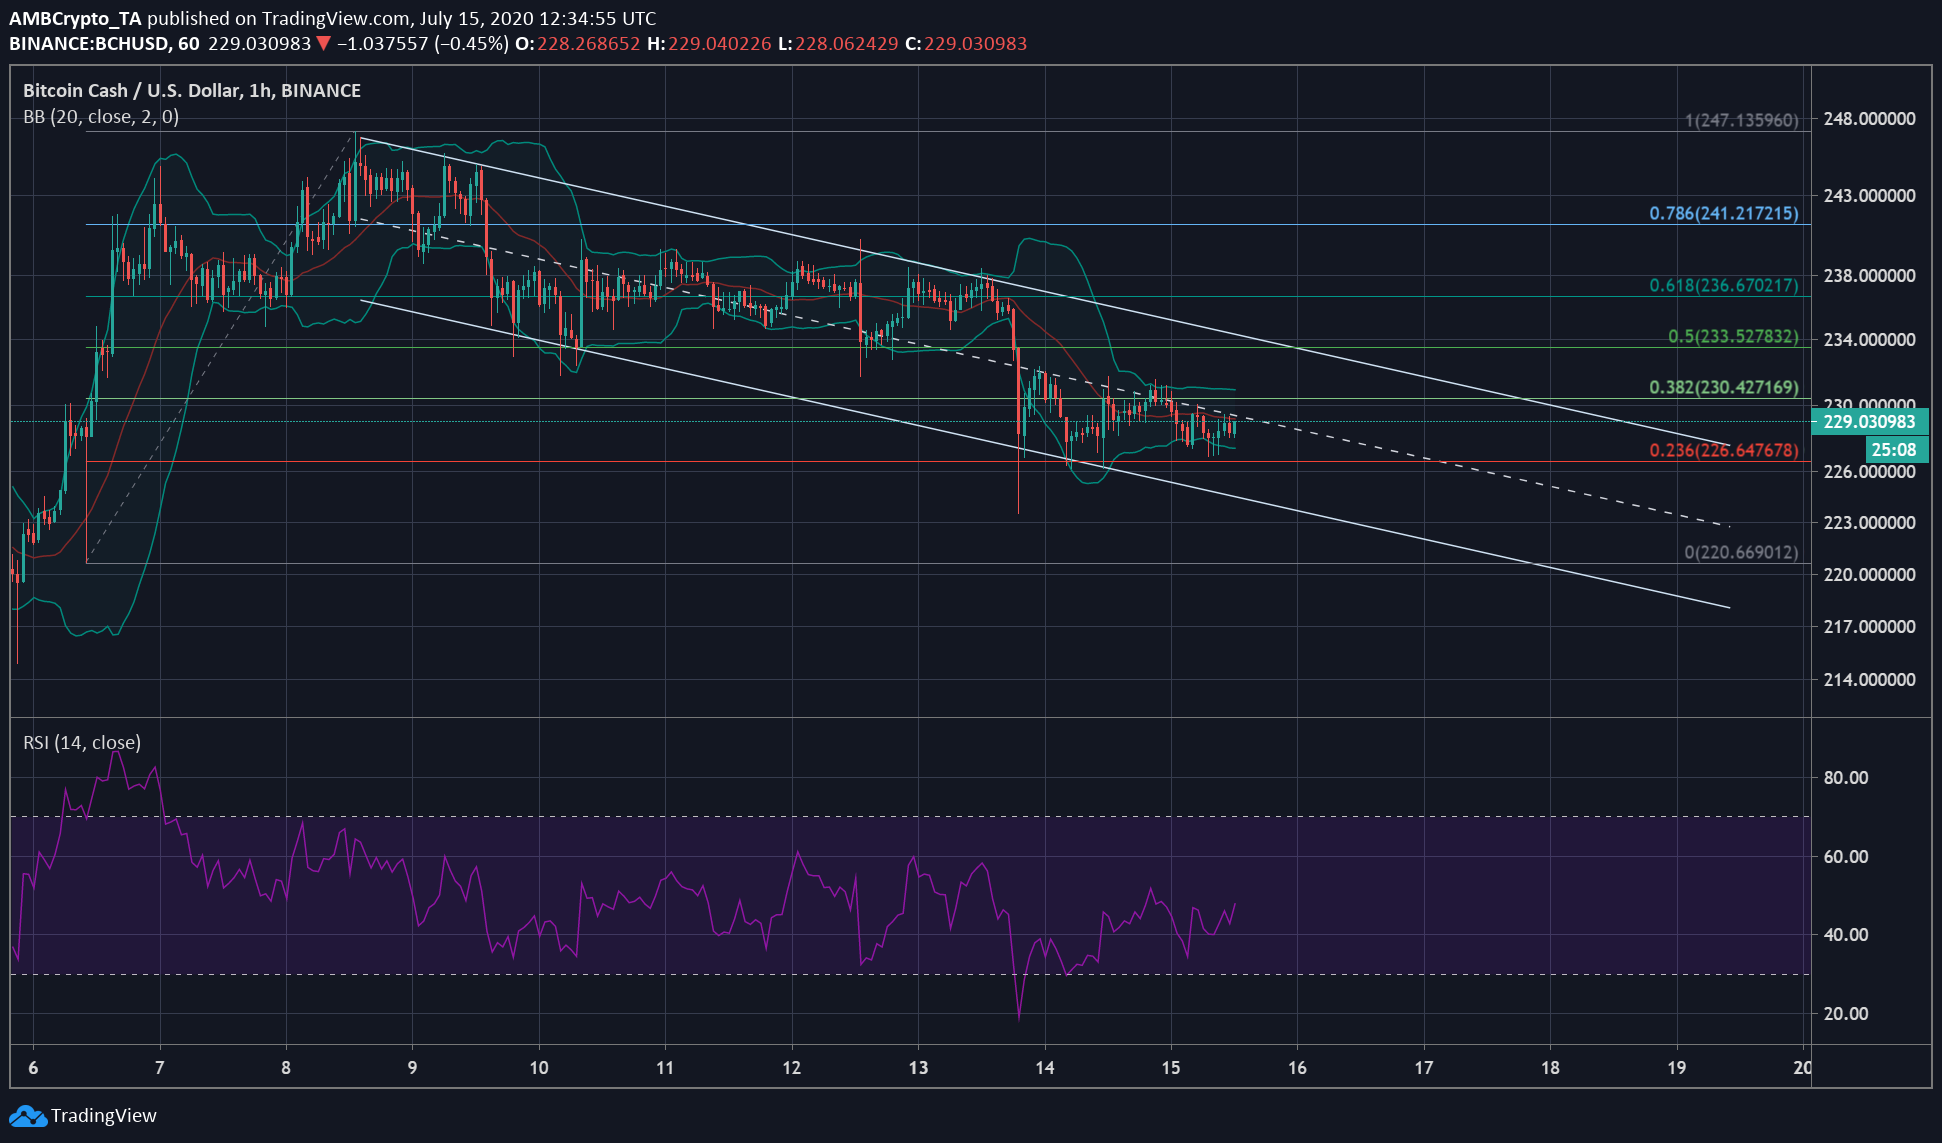
Source: BCH/USD on TradingView
According to the hourly chart of Bitcoin Cash, the shrinking price of the digital asset was clearly visible. This devaluation was forming a part of a descending channel, that connected the lower highs and the lowers lows. As the price trended low, the BCH market has been opening up to more volatility as the Bollinger Bands diverged.
However, the signal line has been indicating the existing price trend to prevail as it was aligned above the candlesticks. As per the Fib Retracement tool, the coin was in between its immediate support at $226.64 and immediate resistance at $230.42. If the price breaks lower, it may bounce back from $226.64, but it will require more momentum to breach above the $230.42 resistance. If the coin breaks this resistance the next stop might be at $236.67, as there was not much resistance at $233.52.
According to the Relative Strength Index, the coin jumped back from the oversold zone on 13 July but reached closer to the zone twice. The current positioning of the RSI indicated that the coin has been evening out the buying and the selling pressure, but the downtrend might push the coin closer to the oversold zone.
Even though an upward push to the price can be expected due to a descending channel, the coin may continue to trend lower for a little while as the immediate resistance was a part of the descending channel.
The post appeared first on AMBCrypto


