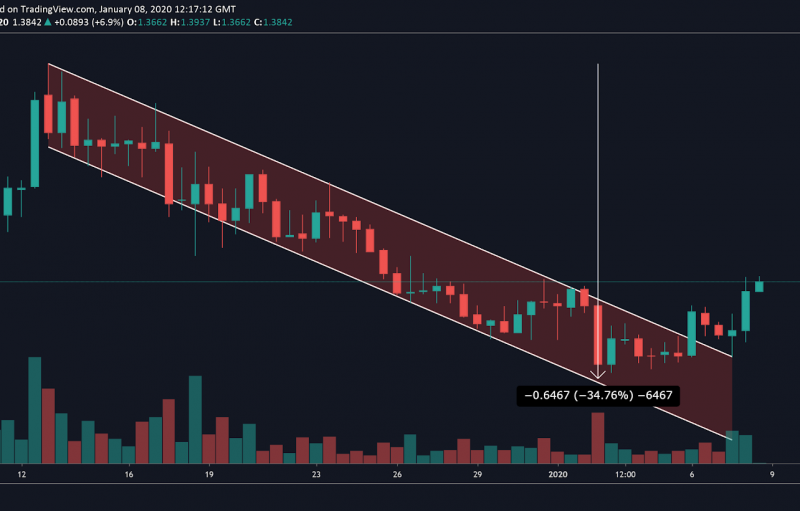
Bitcoin struggles to move out of the consolidation phase that began in late November 2019. Here’s what it would take to trigger a BTC breakout.
Bitcoin Technical Analysis
After peaking at nearly $14,000 in June 2019, Bitcoin went through a corrective period that saw its price drop over 50%. The significant selling pressure took BTC down to the 61.8% Fibonacci retracement level where it has been hovering over the past two months. This Fibonacci retracement area is considered by many traders as the ‘golden’ retracement zone due to the high probability of a rebound.
Yet, the buying pressure behind the pioneer cryptocurrency must increase to allow it to bounce off the current price levels. If volume indeed picks up, then Bitcoin could have the potential to surge to the 50% Fibonacci retracement zone that sits at $8,500.
Conversely, an increase in supply could push BTC below the ‘golden’ retracement zone. Such a bearish impulse could trigger a major sell-off sending this crypto down to the 78.6% Fibonacci retracement level, around $5,500.
BTC/USD by TradingView
The ambiguous outlook that Bitcoin presents is also perceivable on its 1-day chart. Under this time frame, BTC can be seen trading between the lower and upper Bollinger bands since the beginning of December 2019. The low levels of volatility made the bands squeeze, which indicates that a period of high volatility is underway.
Due to the inability to determine which direction the flagship cryptocurrency will breakout, the current trading range between $6,880 and $7,660 is a reasonable no-trade zone.
A daily candlestick close below the $6,880 support level would likely be followed by a move down to the 78.6% Fibonacci retracement level. However, breaking above the $7,660 resistance level could take BTC to the 50% Fibonacci retracement level.
Overall Sentiment
The market sentiment around Bitcoin is in “fear,” according to the Crypto Fear and Greed Index. As BTC continues to hover around $7,000, investors worry it could test lower lows extending the bearish trend it entered in June 2019. Based on the previous technical analysis, such a bearish perspective is extremely feasible. However, it remains to be seen whether the support or the resistance level will break first, which will determine the direction of the overall trend.
The post appeared first on CryptoBriefing


