Off-late, Bitcoin has been moving sideways on the charts and hasn’t exactly been the center of attraction either. Today, DeFi, yield farming, and liquidity pools are the hype. While DeFi has temporarily stolen the spotlight, altcoins seem to be enjoying Bitcoin’s respite.
One thing to note here is that despite Bitcoin’s almost-dormant price action, the OI for BTC Futures and Options did peak momentarily. It’s almost as if Bitcoin is waiting for a perfect moment to splash that pent up volatility, one that can contribute to a sudden spike/crash in the crypto-asset’s price.
For now, Bitcoin’s price is still under $12,000, but well above $11,000. However, the future for Bitcoin’s price didn’t seem so bright, at least on the weekly time frame, at the time of writing.
Bitcoin 1-week chart


Source: BTCUSD on TradingView
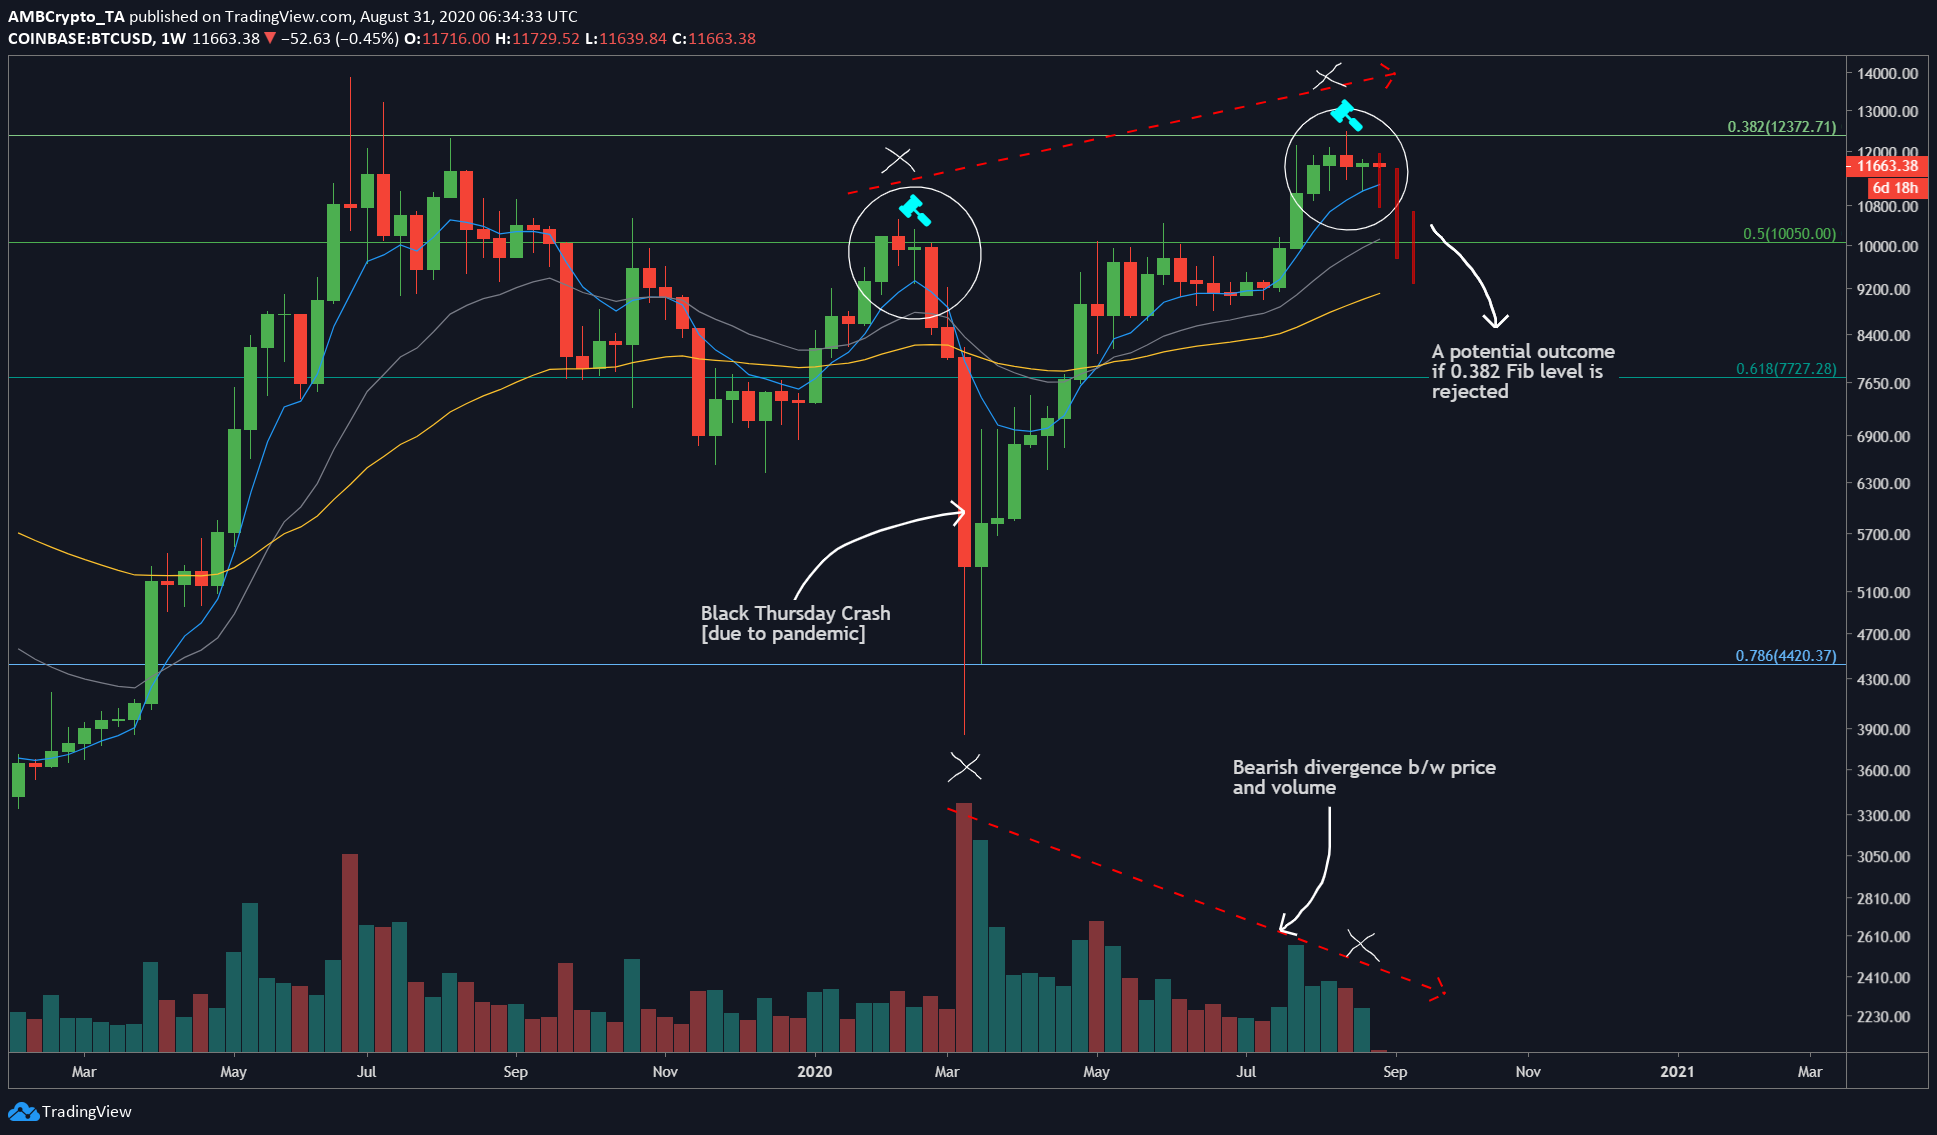
The 1-week chart for Bitcoin shows an important fractal, the completion of which was followed by the disastrous crash in March, and particularly on Thursday. This crash was due to a cocktail of reasons that included the COVID-19 pandemic, recession, and a pause in the economies of the world’s most powerful nations. Expecting a similar crash would be foolish; in fact, expecting the fractal to repeat again would also be foolish as past price doesn’t necessarily indicate a similar outcome in the future.
Regardless, based on the assumption that the fractal might repeat, these are the targets for Bitcoin for the next couple of weeks.
The Fractal
The fractal is simple, a green candle that closed above an important Fibonacci level [0.5] on 03 February. Following this are two weekly candles – The first candle closed below the aforementioned Fibonacci level and the next candle showed a lot of indecisiveness [spinning top candle] between buyers and sellers. After this spinning top candle formation, the price of Bitcoin dropped off like a waterfall from $10,500 to $3,858 in almost 3 weeks.
A similar play is underway now as the first weekly candle on 10 August was a green candle. However, it closed below the next Fibonacci level [0.382]. This was followed by a red candle, which was proceeded by a spinning top candle. Surely enough, the next candle, which opened today, on the 31st of August, had already turned red, at the time of writing.
Although a week’s time is still left, the bulls’ strength seemed to have waned off. The reason for this was the bearish divergence between the price and the volume: As can be seen, the red dashed line showed the price forming higher highs while the volume formed a lower low, hence, forming a bearish divergence.
Conclusion
It is too early to determine how the current weekly candle is going to close. Over the course of the next week, things might change and so will Bitcoin’s outlook. However, based on the press time technical aspects of Bitcoin, the price is due for a correction, one that might be accompanied by the volatility spoken of earlier. Besides, the CME gap at $9,665 is yet to be filled and this might be the chance.
The post appeared first on AMBCrypto


