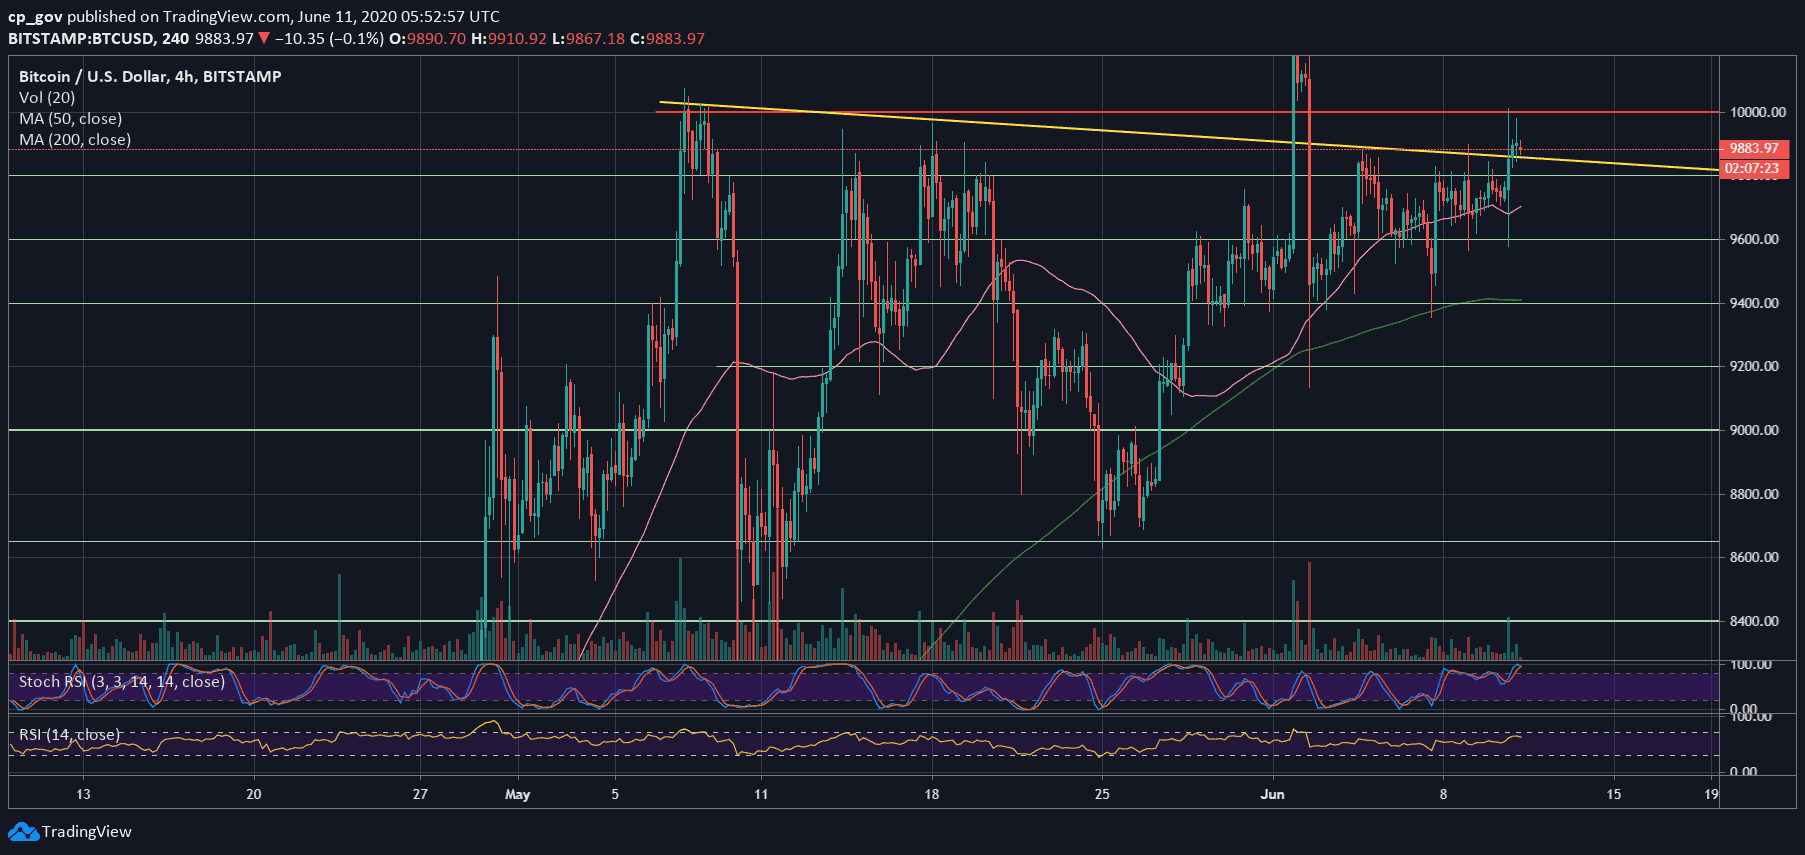
Quick recap: since May 7, 2020, which was a few days before the recent halving event, Bitcoin had been trying to breach the $10,000 benchmark level for several times.
All of those ended up as failed attempts. The most serious attempt took place during the first day of June, as Bitcoin surged to the 2020 high at $10,500 but quickly retraced no more than 24 hours after.
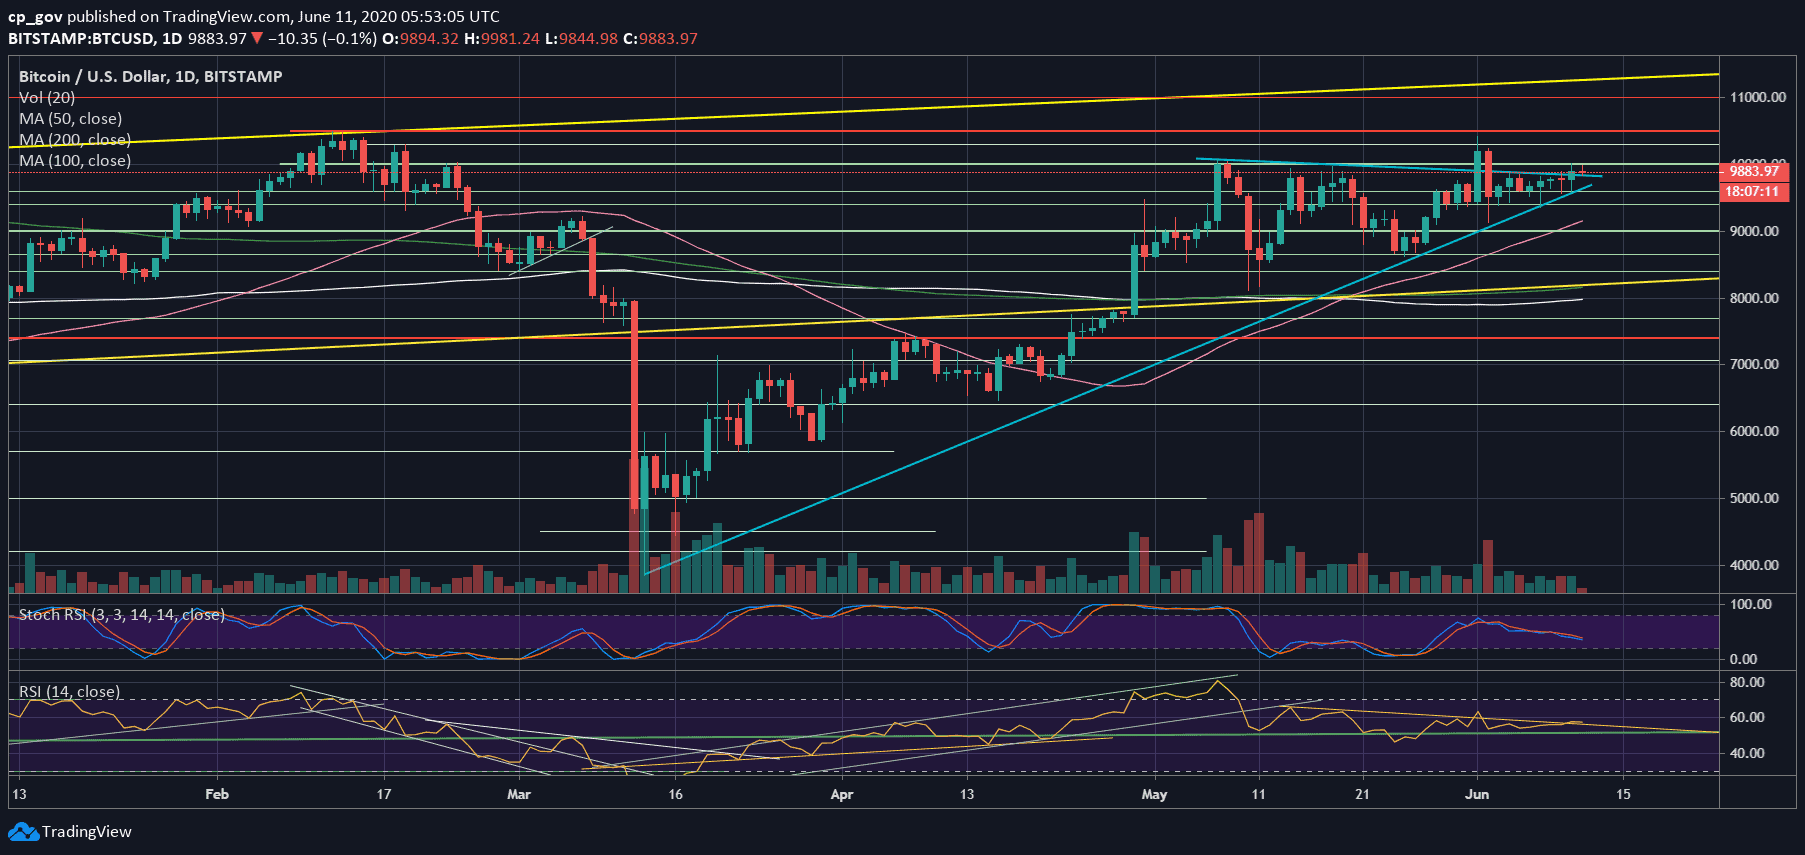
Yesterday, on our previous BTC price analysis, we mentioned that Bitcoin’s mid-term symmetrical triangle is coming to its apex, and a decision is soon to be made (2-3 days).
The past days we saw Bitcoin trading inside the range of $9600 – $9800, and yesterday Bitcoin reached a high of $10,011 on Bitstamp, but couldn’t persist. Since then, Bitcoin is trading safely between the next range of $9800 – $10,000. As mentioned yesterday, this range is also full of sellers’ demand chunks.
Breakout – A Matter of Time?
The more attempts to break a resistance line, the higher the chances it will actually break-up. What we see with the $10,000 is an endless psychological battle.
Even during November 2017, when Bitcoin broke the 5-digit level for the first time, it was easier and quicker than in 2020. In my opinion, there is a remarkably high chance of seeing it happening today.
Aside from the price, in order to hold the 5-digit mark, we will have to see a decent volume of buyers, which is not yet here, along with a breakup reflected by the RSI indicator (which is also indecisive over the past week).
Key Support and Resistance Levels
Now, as Bitcoin’s trading range between $9800 and $10,000, the first crucial support is the $9800 level, followed by the blue ascending trend-line on the daily chart (currently around $9670). Further below lies $9600, and $9400.
From above, the first resistance level is the $10,000, followed by $10,200 and the 2020 high at $10,500. The latter is even more critical level than the $10K itself. Bitcoin reached the 2020 top twice so far – mid-February before the COVID19 crisis, and on the first day of this month – June 2020.
Total Market Cap: $281 billion
Bitcoin Market Cap: $182 billion
BTC Dominance Index: 64.8%
*Data by CoinGecko
BTC/USD BitStamp 4-Hour Chart
BTC/USD BitStamp 1-Day Chart
The post Bitcoin Price Analysis: Another Failed Attempt At $10K, But Will BTC Finally Break-Up Today? appeared first on CryptoPotato.
The post appeared first on CryptoPotato


