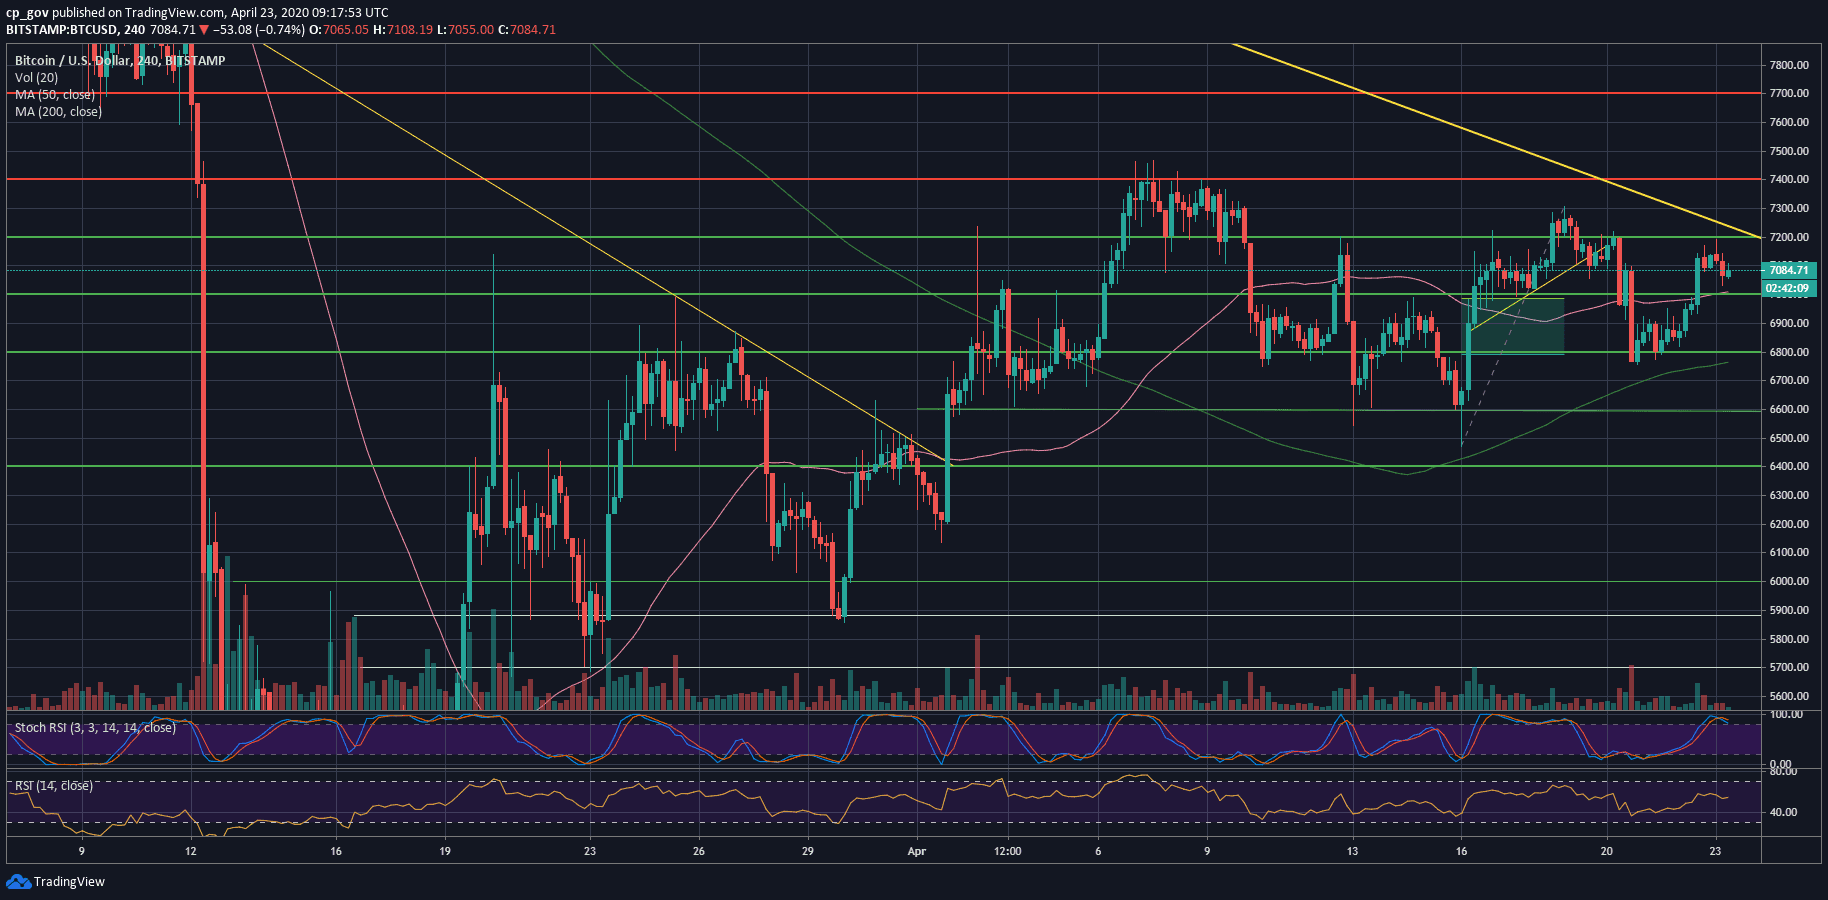
Over the past days, after getting rejected at the $7300 price level, Bitcoin followed the global markets 2-day drop and fell straight to the $6800 support.
Looking at the Bitcoin chart, we can see that the latter is also a significant 61.8% Golden Fibonacci level, as mentioned in our most recent BTC price analysis.
Bitcoin nicely held that support, along with the 50-days moving average line – marked pink on the following daily chart. Yesterday, following the deep-green on Wall Street, Bitcoin price gained $400 to retest the $7200 resistance level.
As of writing these lines, Bitcoin got rejected and now trading steadily above the $7K mark, so despite the decent surge in price, Bitcoin’s short-term direction had not changed much (yet).
Looking at the 4-hour chart, we can see a lower-high trajectory, which is not in favor of the Bulls. This will be invalidated in case Bitcoin breaks above $7300, together with the marked descending trend-line, and also confirms it as support.
Total Market Cap: $205.3 billion
Bitcoin Market Cap: $130.3 billion
BTC Dominance Index: 63.5%
*Data by CoinGecko
Key Levels To Watch & Next Possible Targets
– Support/Resistance levels: As mentioned above, Bitcoin is facing $7200 as the first level of resistance, followed by $7300.
In case of a break-up, we can expect a quick move towards the monthly highs at $7400 – $7500. Further above lies the $7700 mark, which will be considered a “full recovery” from the March 12 plunge.
From below, the first level of support now lies at $7000. In case the latter breaks down, then the next support is the $6800, along with the mentioned MA-50 (currently around $6770). Further below lies $6600 and $6300 – $6400 price area.
– The RSI Indicator: The momentum indicator, the RSI, tells the same story as the price, lower highs. We will need to see a higher high in the price, along with a higher high of the RSI to continue higher. The RSI is still hovering around the neutral level of 50.
– Trading volume: Despite the recent days’ price action, the volume was not significant compared to the monthly average, and continues the daily volume decrease since the yearly-high of March 12 and 13.
BTC/USD BitStamp 4-Hour Chart
BTC/USD BitStamp 1-Day Chart
The post Bitcoin Price Analysis: BTC Gains $400 Today, But Before Seeing New Highs This Pattern Must Be Invalidated appeared first on CryptoPotato.
The post appeared first on CryptoPotato


